table of contents
You manage a SOC team buried in alerts. Threats slip through anyway. EDR effectiveness metrics show if your tools deliver or just add noise.
Endpoint detection and response systems promise fast threat hunting. Yet without solid measures, you can’t prove their value. Teams waste time on tuning that doesn’t stick.
This post breaks down metrics you need. You’ll learn how to track detection quality, speed up responses, and tie it all to business wins. Start with operational basics, then build to bigger impacts.
Core Operational Metrics for Detection
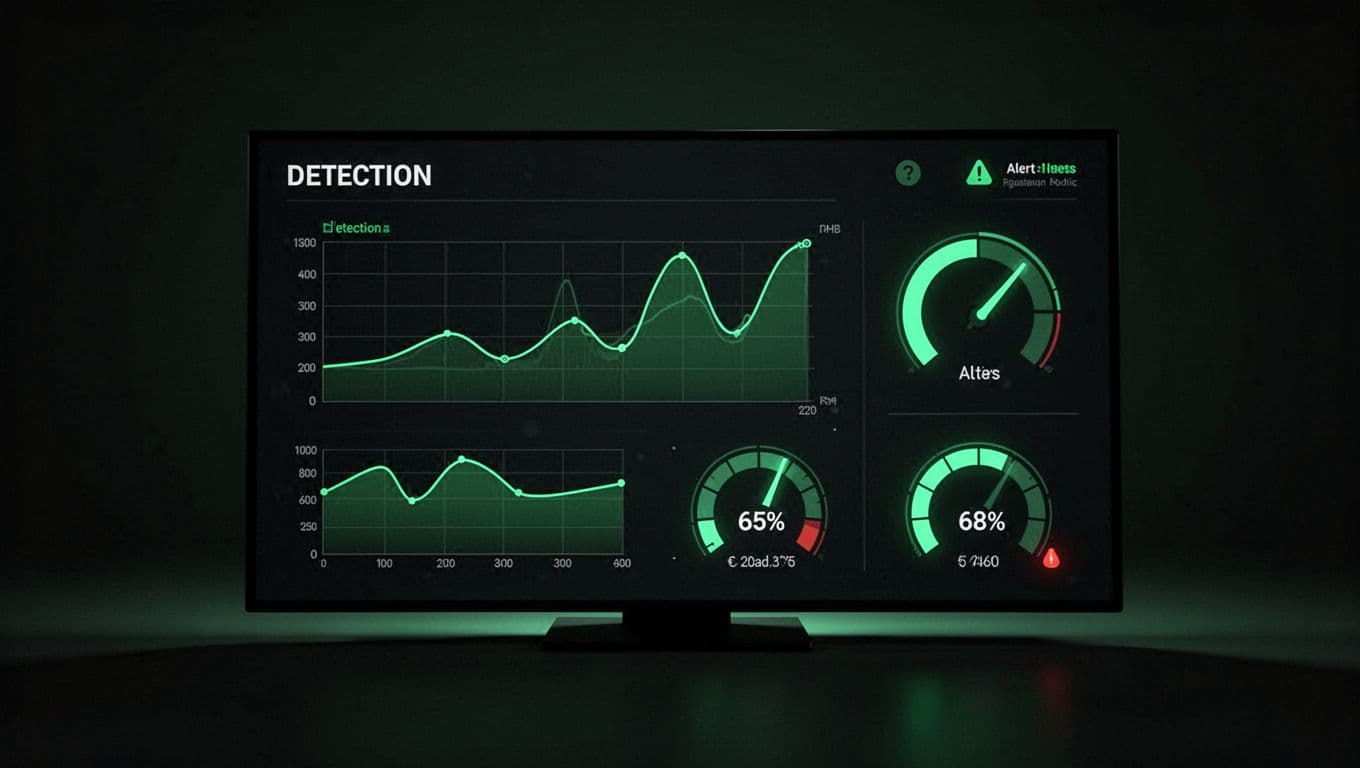
Detection starts everything in EDR. Miss a foothold, and attackers roam free. Track these metrics daily to spot gaps.
Mean time to detect (MTTD) tops the list. Calculate it as the average time from threat start to first alert. Divide total detection lag by incidents. Aim for under 1 hour in 2026; anything over signals blind spots.
Next, true positive rate. It’s confirmed threats divided by total alerts. A 70% rate means most work pays off. Below 50%? Tune rules or swap tools.
Threat coverage fits here too. Map alerts to MITRE ATT&CK techniques. For example, check persistence or lateral movement. MITRE’s evaluation metrics like visibility and analytic coverage give benchmarks. If your EDR misses 30% of techniques, run purple team tests.
SOC teams use these to prioritize. One team cut MTTD by 40% after focusing on low-coverage tactics. They added custom YARA rules. Result? Fewer breaches.
Alert volume per endpoint rounds it out. High numbers strain analysts. Target 1-2 alerts daily per 1,000 endpoints. Trends up? Check for new malware families.
These metrics guide tool tuning. Review weekly. Adjust exclusions or enrich data feeds. Your detection gets sharper fast.
Response Time and Speed Metrics
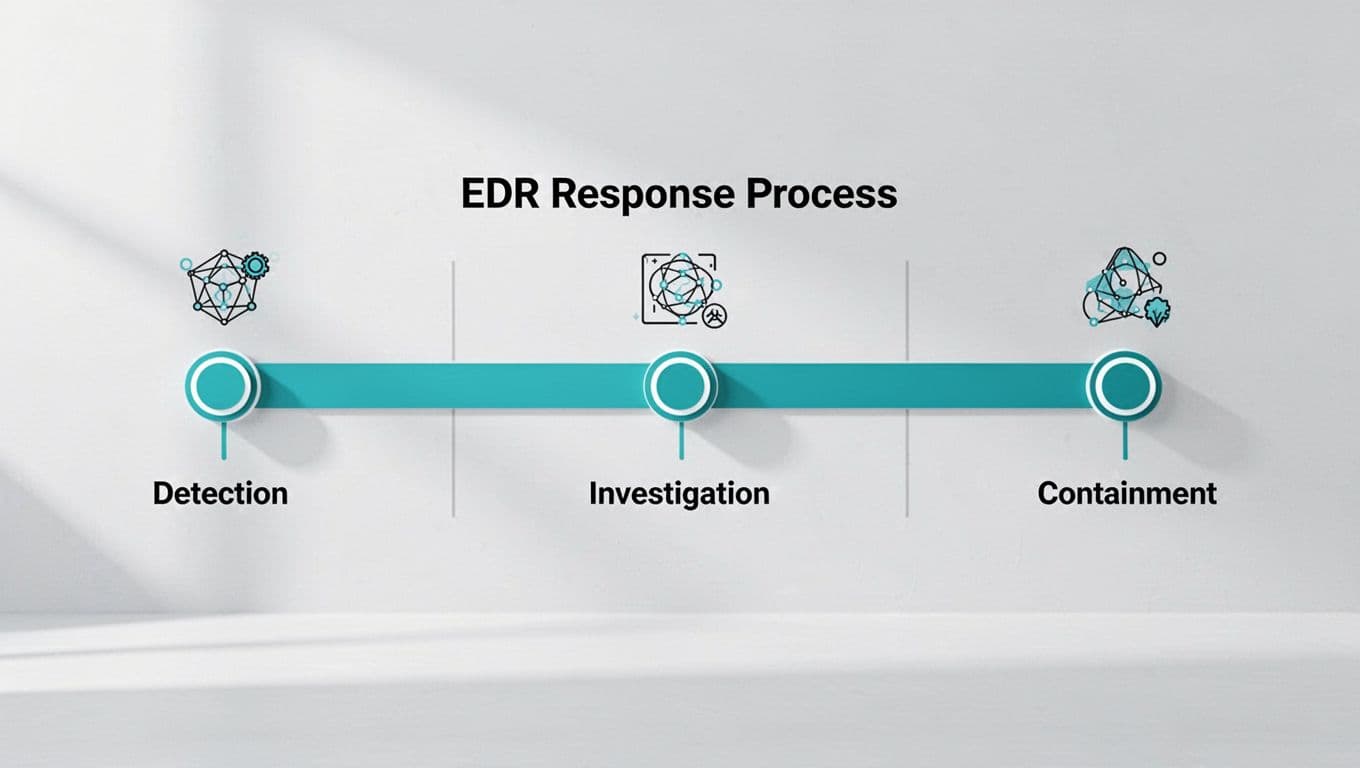
Detection alone won’t save you. Response speed decides breach scope. Measure from alert to action.
Mean time to respond (MTTR) covers triage to containment. Time each phase: investigate, then remediate. Average across incidents. Under 4 hours beats industry norms.
Break it into mean time to investigate (MTTI) and mean time to contain (MTTC). MTTI tracks analyst dig time. High MTTI points to poor context in alerts. Add EDR timelines or process trees.
Containment success rate follows. It’s successful stops divided by attempts. 95% or better shows solid playbooks. Failures mean gaps in automation, like script blocks.
SOC managers watch escalation rates. If juniors pass 60% of cases up, train them more. Or automate low-severity triage.
One SOC slashed MTTR from 8 hours to 2 by scripting common responses. They focused on high-volume alerts first. Speed reduced data exfil by half.
Track these in shifts. Daily for speed, monthly for trends. Pair with staffing ratios. Slow times often mean overload.
False Positive and Noise Metrics
Noise kills SOC morale. False positives eat hours on nothing. Measure them right to reclaim time.
False positive rate (FPR) is key. Divide non-threat alerts by total alerts. Under 20% is good; over 40% demands overhaul. Palo Alto’s endpoint guide stresses this for effectiveness.
Weigh by effort. Not all FPs equal. Track mean time per false alert. Quick closes cost little; deep dives drain.

Analyst fatigue score helps. Survey burnout after high-FPR weeks. Or count alerts closed without action.
Tune by whitelisting safe behaviors. Test rules in staging. One team dropped FPR 25% by excluding legit admin tools.
False negatives matter too, though harder to spot. Use breach simulations. Low detection in tests flags misses.
Review FPR weekly. Correlate with threat intel. Noise down means focus shifts to real risks.
Coverage and Visibility Metrics
Blind spots doom EDR. Coverage metrics reveal what you see.
Telemetry coverage first. Percent of endpoints sending full data. 98% minimum; drops signal agent issues.
Analytic coverage per MITRE. Tenendo’s evaluation quantifies technique detection. Partial alerts count half. Aim for 80% full coverage on top tactics.
Visibility score combines them. MITRE sums steps seen across attacks. Higher means better graph for hunting.
SOC teams benchmark quarterly. Run ATT&CK evals. Gaps? Patch agents or add network logs.
One firm found 20% telemetry gaps post-merger. Fixed agents, coverage jumped 15%. Fewer misses followed.
Asset coverage ties in. Protected endpoints versus total. Include BYOD. Low rates expose risks.
These metrics justify budgets. Show execs gaps cost more than fixes.
Program-Level KPIs for SOC Teams
Metrics scale to team health. Program KPIs link EDR to operations.
Analyst workload is first. Alerts per analyst per shift. Under 50 keeps focus sharp. Over 100 burns out staff.
Automation rate next. Percent of alerts handled by SOAR. Target 40% in 2026. Scripts for isolation boost it.

SLA compliance tracks promises met. 90% on response times builds trust with business units.
Escalation and resolution rates show maturity. Low escalations mean skilled juniors.
Secureworks’ SOC KPIs list these as must-haves. Teams use them for staffing. High workload? Hire or automate.
Cross-train on metrics. Monthly reviews spot trends. One SOC cut workload 30% via tuning, added headcount strategically.
These KPIs forecast needs. Tie to EDR tuning for efficiency.
Business Impact Metrics
EDR proves value in dollars. Business metrics connect security to bottom line.
Cost per incident leads. Tally response hours, lost time, fines. Divide by incidents. Drops show ROI.
Risk reduction score. Pre- and post-EDR breach likelihood. Simulations quantify it.
Mean time to value. From deploy to first win. Short means quick payoff.
Compliance lift. Audit passes tied to metrics. Helion’s EDR usage post notes severity trends.
SOC leaders dashboard these quarterly. Show execs savings. One team proved $2M annual save via lower incidents.
Breach cost avoided caps it. Multiply prevented attacks by average loss. Big numbers silence doubters.
Conclusion
Strong EDR metrics sharpen your edge. Track MTTD, FPR, coverage, and impacts to build a tight SOC.
Focus on trends over snapshots. Weekly ops reviews, quarterly benchmarks keep you ahead.
Your team stops more threats with these numbers. Staffing aligns, tools tune right, risks drop.
Book a Discovery Call with Bud Consulting to audit your metrics setup.