table of contents
A shrinking vulnerability backlog can look good on a slide and still hide growing risk. That’s why CTEM metrics matter. They show whether your team is finding, proving, and reducing the exposures that attackers can actually use.
In 2026, the strongest programs want more than scan output. They want proof, context, and decisions tied to business impact. The difference starts with what you choose to measure.
Why CTEM metrics look different from legacy security KPIs
Traditional vulnerability management KPIs often track activity. Open findings, patch rates, and scan completion all have value. However, they don’t always show whether risk is going down.
CTEM changes the scorecard. As CyCognito’s view of CTEM KPIs explains, the focus shifts from volume to impact. Recent discussion of the CTEM divide makes the same point: visibility without proof rarely changes outcomes.

In other words, CTEM metrics ask harder questions. How much of the important attack surface do you see? Which exposures are reachable? Which ones were validated? How fast are teams fixing the issues that matter most?
If discovery jumps after coverage expands, treat that as a visibility win, not a CTEM failure.
A lean executive scorecard can stay simple:
| Metric | What it shows | Decision it supports |
|---|---|---|
| Asset coverage | How much of the critical estate is in scope | Where blind spots remain |
| Exposure discovery rate | New meaningful exposures per cycle | Whether visibility is improving |
| Exploitability context | Reachability and attack-path relevance | What to fix first |
| Validation rate | Share of priority findings proven in testing | Which issues deserve urgent action |
| Remediation SLA adherence | Fixes closed within target windows | Whether teams meet policy |
| Mean time to remediate high-risk exposures | Average days to close validated high-risk issues | Where workflow friction sits |
| Exception rate | How often teams accept risk instead of fixing | Whether risk debt is growing |
| Risk reduction over time | Change in validated exposure volume or weighted risk | Whether CTEM lowers exposure |
| Exposure recurrence | How often fixed issues return | Whether fixes stick |
The pattern is clear. Good CTEM metrics help leaders decide where to focus people, time, and budget.
The metrics that show whether you’re fixing the right exposures
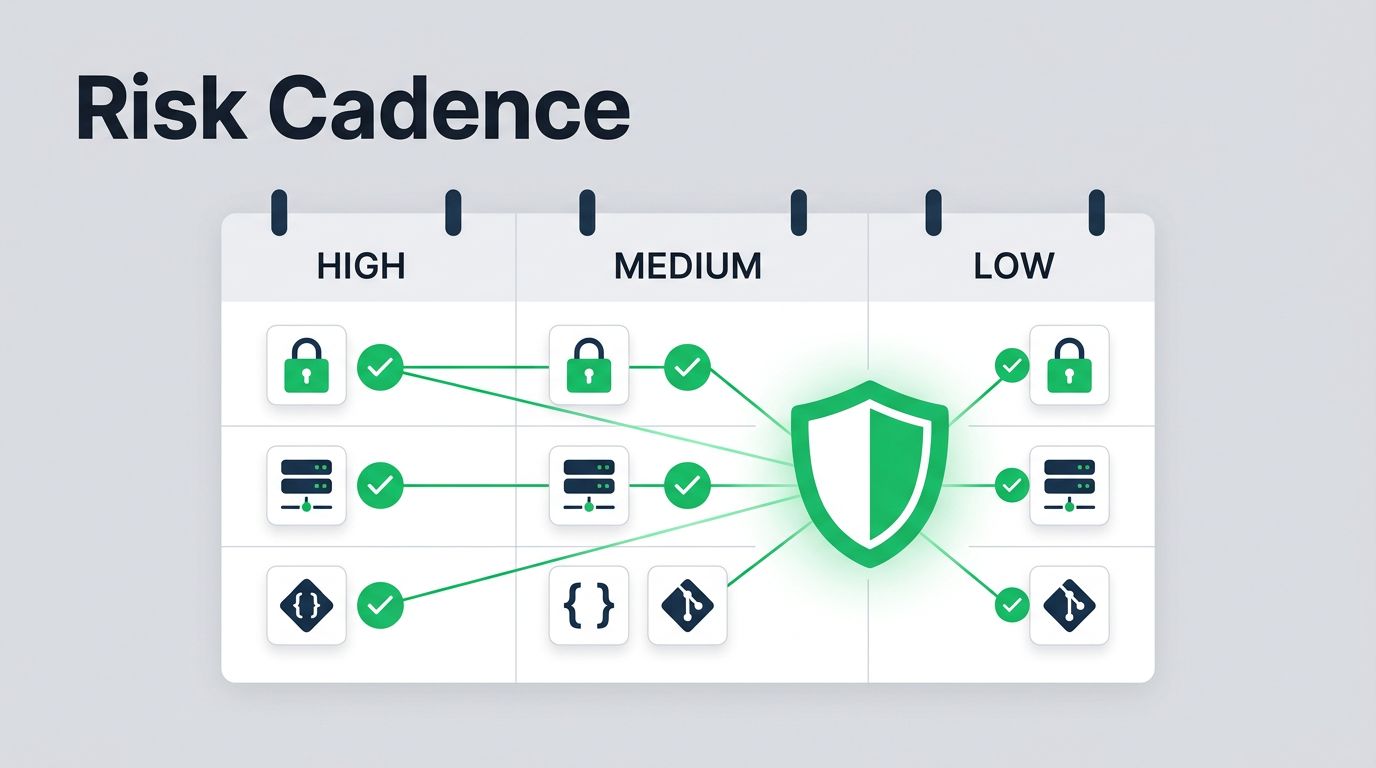
Start with asset coverage. This should track the share of critical assets, business services, and attack paths inside the CTEM cycle. Don’t treat every asset the same. A payment app, admin identity path, and public cloud control plane deserve more weight than a low-value test box.
Next, watch exposure discovery rate. Early in a CTEM program, this number may rise fast. That’s often healthy because coverage is improving. What matters is whether the rate stays high because the environment keeps changing, or because long-known blind spots still exist.
Then add exploitability context. This is where CTEM pulls away from older programs. A finding with a high severity score may still be low priority if it isn’t reachable, lacks a usable path, or sits behind strong controls. On the other hand, a medium issue tied to exposed credentials, identity abuse, or a direct path to a crown-jewel system can move to the top of the queue.
Validation rate is another strong signal. It measures how many prioritized exposures are proven through testing or control validation. As Superna’s write-up on continuous risk reduction points out, this is where teams move from assumption to evidence.
After that, track remediation SLA adherence and mean time to remediate high-risk exposures. Keep both tied to validated, business-relevant exposures. Otherwise, teams can improve the number by closing easy tickets while risky paths stay open.
Finally, keep an eye on exception rate. This is the smoke alarm for risk acceptance drift. A few exceptions are normal. A rising exception rate around internet-facing or high-value assets usually means ownership, funding, or technical debt needs attention.
How to prove CTEM is reducing risk over time
Leaders care most about trend lines. That makes risk reduction over time one of the most useful CTEM metrics on the board slide. Measure it by business service, attack path, or crown-jewel scope, not only across the whole estate. Broad averages can hide the systems that matter.

Pair that with exposure recurrence. If the same cloud misconfiguration returns every sprint, the problem isn’t patching speed. It’s process failure, weak guardrails, or poor change control. Recurrence turns one-off fixes into a quality measure.
Also track control performance validation. A patch may land on time, yet the attack path may still work because segmentation failed, identity controls were too loose, or detection never fired. This is another place where CTEM differs from classic vulnerability management. The older KPI asks, “Was the ticket closed?” CTEM asks, “Can an attacker still get through?”
For executive reporting, keep the story tight. Show three things: coverage of critical scope, validated high-risk exposure trend, and time to close the worst items. If those move in the right direction, the program is doing its job. If they stall, you know where to dig deeper.
The best CTEM metrics don’t reward motion. They reward fewer validated paths to important assets.
Start with a small scorecard, tie every metric to a decision, and review it every cycle. If a number can’t change priority, ownership, or spend, it probably doesn’t belong.
Pick the three that matter most to your program right now, then make them hard to ignore.