table of contents
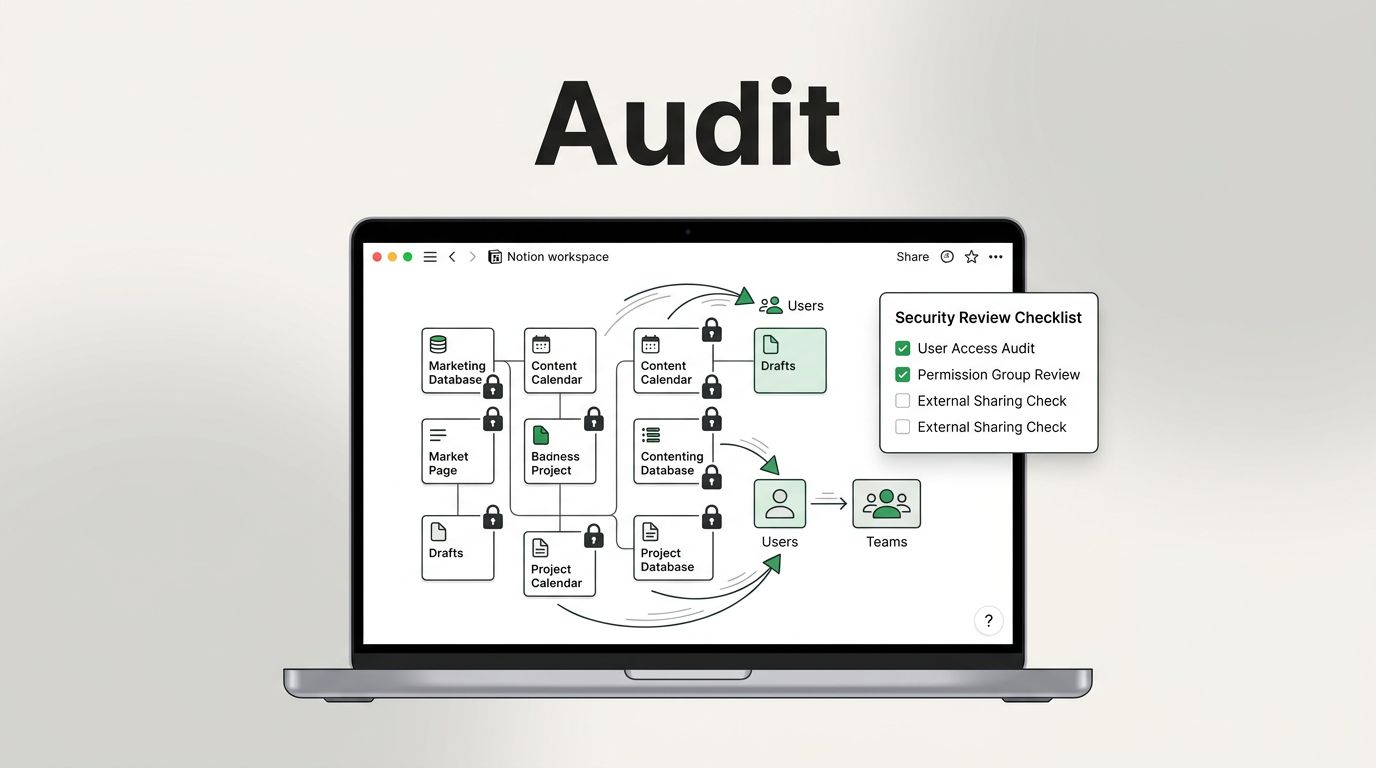
Training completion looks neat on a slide, but it rarely tells you whether people are safer. In 2026, leaders need human risk metrics that show real behavior, real exposure, and real business impact.
That shift matters because people remain part of most security failures, especially through phishing, credential misuse, and avoidable mistakes. If your reports still focus on attendance and click rates alone, you’re missing the bigger picture.
The right metrics help you decide where to spend, what to fix, and what to tell the board. They also give your security team a clearer path from awareness to measurable risk reduction.
The human risk metrics leaders should trust
A useful metric does three things. It shows a trend, it links to a control, and it leads to action. If a number cannot do all three, it belongs in a support chart, not the main report.
Recent 2026 reporting still points to people as a major breach factor, which is why the move from awareness-only programs to behavior-based measurement keeps growing. For a useful context on that shift, see this 2026 view of human cyber risk management.

Three metrics deserve a place near the top of most dashboards:
- Phishing susceptibility rate shows how many people still fall for simulated or real lures. It matters because it reveals current exposure, not past training attendance.
- Behavior adoption score tracks whether people are using safer habits, such as reporting suspicious email, using approved tools, and following policy around data sharing.
- Outcome-based incident measures show what changed in the real world, such as fewer account takeovers, fewer repeat mistakes, and faster reporting of suspicious activity.
You can read more about practical human risk measurement in Mimecast’s guide to key metrics. The main point is simple, measure what people do, not only what they complete.
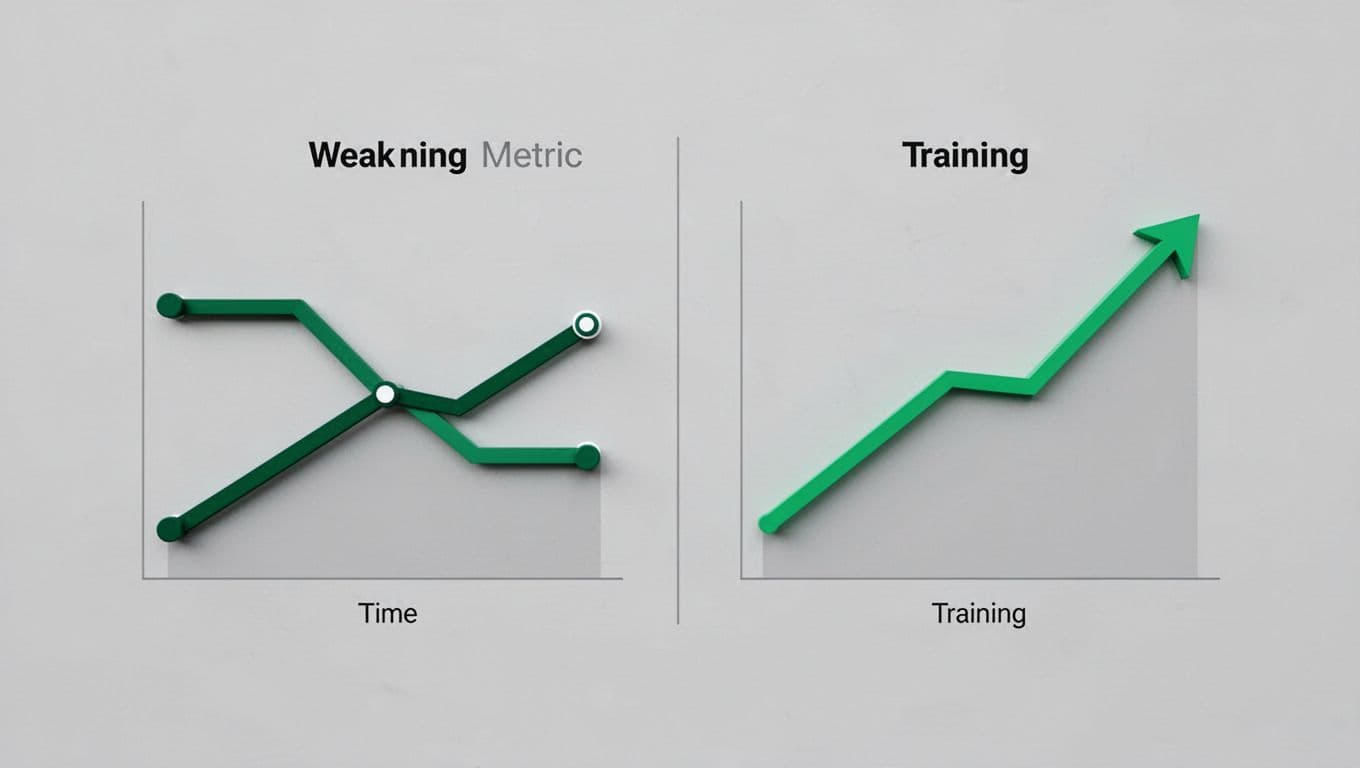
Strong metrics beat weak ones
A weak metric often measures effort. A strong metric measures effect. That difference sounds small, but it changes how leaders act.
Use this quick comparison to sort the noise from the signals.
| Weak metric | Stronger metric | Why leaders care |
|---|---|---|
| Training completion rate | Change in phishing susceptibility | Shows whether people changed behavior |
| Number of courses assigned | Repeat risky actions by user group | Reveals who needs help and where |
| One-time phishing click rate | Click rate trend by role or business unit | Identifies risk concentration |
| Policy acknowledgement | Rate of approved behavior adoption | Shows whether policy affects daily work |
| Hours of awareness training | Fewer human-caused incidents | Ties effort to business outcomes |
If your dashboard is full of weak metrics, you may be measuring activity instead of risk. That creates comfort without control.
If a metric cannot guide a decision, it is reporting noise.
How to read the numbers and act on them
Good reporting does more than show a score. It explains what changed, why it changed, and what to do next.
Start by looking at trend lines, not single snapshots. A high phishing rate is useful only if you know whether it is improving, flat, or rising after a campaign. Next, segment the data by role, department, and access level. A small group with privileged access can create far more risk than a large group with limited access.
Then connect each metric to a control. If one team keeps failing phishing tests, the answer may be targeted coaching, tighter mail controls, or better reporting habits. If a group keeps sharing data through unsanctioned apps, the fix may involve process change, not more training.
Useful action questions include:
- Which behavior changed after the last campaign?
- Which teams still repeat the same risky act?
- Which metric points to actual business exposure?
- Which control reduced the risk, not just the score?
If your program needs help moving from report output to risk reduction, Book a Discovery Call with Bud Consulting and turn the metrics into an action plan.

How to report human risk to boards, insurers, and compliance teams
Boards want a short story with clear consequences. They do not need every data point. They need to know whether human risk is rising or falling, where the biggest exposure sits, and what the team is doing about it.
For board reporting, keep the message tight. Show three things: the top human risk trend, the area with the most exposure, and the control that changed the outcome. That structure turns a security report into a management tool.
Cyber insurance conversations need the same discipline. Insurers care about evidence that people are covered by controls, not just training slides. They want proof of MFA use, phishing resilience, reporting speed, and incident follow-through. Strong human risk metrics help you show that the program is active, not decorative.
Compliance teams also benefit from better metrics. Map your human risk measures to the controls you already track under NIST, ISO 27001, or internal risk registers. That makes audits easier and keeps the story consistent across security, legal, and finance.
The old approach asked whether people attended training. The better question is whether behavior changed and risk went down. That is the kind of reporting leaders can use.
Human risk metrics matter because they connect people to business loss. When the numbers show behavior, exposure, and outcome, leaders can make sharper decisions with less guesswork.
That is the real shift in 2026, from awareness counts to measurable risk reduction.