table of contents
Security teams face a flood of vulnerability data. You spot exposures daily, but turning them into action stalls without clear processes. Continuous Threat Exposure Management, or CTEM, changes that by mapping risks across your attack surface and prioritizing real threats.
CTEM goes beyond scanning. It assesses exploitability, validates findings, and pushes remediation. Jira fits perfectly because it handles tickets, automations, and team collaboration. You can route CTEM findings straight to engineering or IT ops.
This guide walks you through setup. You’ll get step-by-step steps for fields, workflows, and alignment so your team closes gaps faster.
Understand CTEM Basics for Jira Success
CTEM cycles through scoping, discovery, prioritization, validation, and mobilization. Findings emerge from tools like scanners or exposure platforms. Jira turns those into trackable issues.
Start small. Map your current vuln process to CTEM stages. Security triages, then hands off to devs or ops. Without integration, emails pile up and fixes drag.
Gartner coined CTEM in 2021. It focuses on business context over raw scores. For example, a high CVSS vuln on an air-gapped server ranks low. Jira captures that nuance.
Teams win when CTEM feeds Jira directly. Automate imports to avoid manual entry. This cuts errors and speeds response. Your exposure drops as a result.
Define Custom Fields to Capture CTEM Data
Custom fields make CTEM findings actionable in Jira. Add them under Project Settings > Fields. Focus on risk factors first.
Create these essentials:
- Risk Score: Number field (0-100). Combine CVSS, EPSS, and asset value.
- Exploitability: Select list (High, Medium, Low, None). Pull from threat intel.
- Affected Assets: Multi-select or text. List servers, apps, or cloud resources.
- SLA Due Date: Date picker. Set based on priority, like 7 days for critical.
- CTEM Stage: Dropdown (Scoping, Discovery, Prioritize, Validate, Mobilize).
Use Automation for Jira to populate them on import. For instance, trigger on issue creation from your CTEM tool webhook.
Here’s a quick setup table for common fields:
| Field Name | Type | Purpose |
|---|---|---|
| Risk Score | Number | Overall threat level |
| Exploitability | Select List | Active exploits or proofs |
| Affected Assets | Multi-Select | Precise targets for remediation |
| SLA Due Date | Date | Enforcement deadline |
| Business Impact | Text | Revenue or compliance notes |
These fields enable sorting and filtering. Security sees high-risk first; devs get asset details. Test in a sandbox project before rollout.

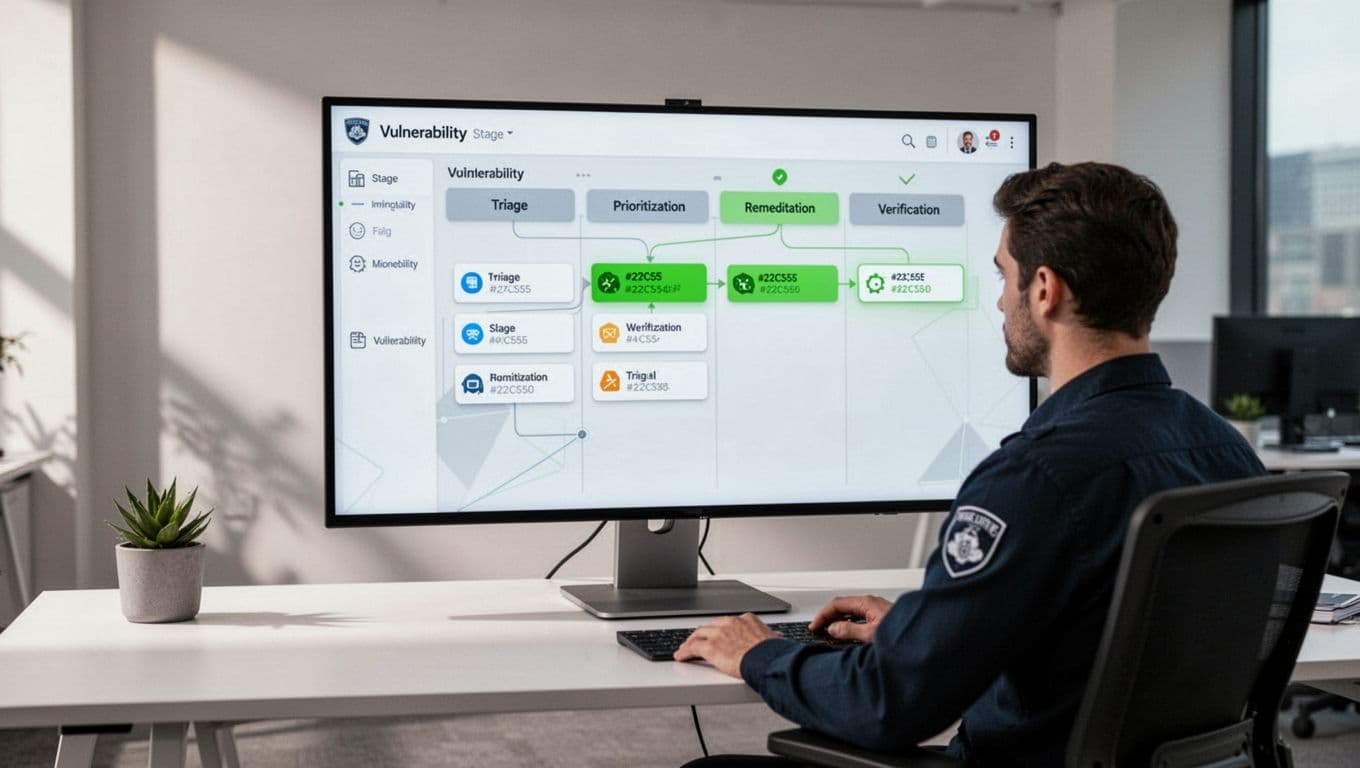
Design Workflows Tailored to CTEM Stages
Build a workflow that mirrors CTEM. Go to Project Settings > Workflows. Duplicate a default like Kanban, then edit statuses.
Key states: New (Triage), Prioritized, In Progress (Remediate), Verified, Closed, Exception.
Transitions need conditions. Block “Remediate” until Risk Score > 70. Add validators for required fields like remediation steps.
Issue templates speed triage. Create one per type: “Cloud Exposure” with pre-filled description, attachments for PoCs.
Automation shines here. Use rules like:
- When issue created via webhook, set CTEM Stage to “Discovery”.
- If Exploitability = High, assign to security lead and notify via Slack.
- On transition to “Remediate”, create sub-tasks for patch, config change, etc.
For deduplication, add a smart value check. If Asset + Vuln matches an open issue, link instead of duplicate.
This setup keeps boards clean. Teams focus on progress, not chaos.
Tools like XM Cyber’s Jira integration auto-populate these fields from exposure scans. It delegates tasks with full context.
Implement Prioritization Models That Stick
Prioritize based on context, not scores alone. Use Jira’s native ranking or custom scripts.
Start with a simple formula in Automation: Risk Score = (CVSS * 0.4) + (EPSS * 0.3) + (Asset Criticality * 0.3). Update on field change.
For advanced, try WSJF (Weighted Shortest Job First). Add fields: Value, Risk Reduction, Effort. Automation calculates score.
Set quick filters on boards: JQL like “Risk Score > 80 AND status != Closed”.
Handle volume with swimlanes by team: Security, Engineering, IT Ops.
Review weekly. Adjust weights as threats shift. This keeps high-impact items top.
Align Teams with Shared Governance
Cross-team alignment prevents silos. Security flags risks; engineering fixes code; ops patches systems.
Set permissions carefully. Security edits risk fields; devs own remediation notes.
Use shared boards or Advanced Roadmaps for visibility. Link issues across projects.
Governance rules enforce flow:
- Require approval for “Exception” status.
- Mandate verification scans before close.
- Track owner accountability with @mentions.
Hold standups around the board. Discuss blockers early.
Define SLAs per priority. Critical: 48 hours to remediate. Use Automation to flag breaches and escalate.
Zafran’s CTEM guide covers routing tasks to owners automatically.
Manage Deduplication, Exceptions, and SLAs
Deduplication avoids noise. Use Epic Links for related findings. Automation rule: On create, search JQL “Asset = {{issue.Affected Assets}} AND Vuln = {{issue.summary}}” then link or comment.
Exceptions need process. Add a sub-workflow: Request > Review > Approve. Attach compensating controls.
SLA tracking uses apps like Jira Service Management. Set timers on transitions. Dashboards show MTTR by team.
Automation closes stale low-risk issues after 90 days, but only post-notification.
These steps cut rework by 40% in mature programs.
Create Dashboards for Visibility and Reporting
Dashboards tie it together. Use gadgets: Two-Dimensional Filter (Status vs Priority), SLA Success Rate, Created vs Resolved.
Filter by CTEM Stage for cycle time. Pie charts show backlog by team.
Export reports weekly. Share with execs: “Closed 150 high-risk exposures this quarter.”
Control charts track velocity. If remediation slows, drill into blockers.
Gadget setup takes minutes. Schedule PDF exports for stakeholders.
Key Takeaways
Integrating CTEM into Jira workflows builds a remediation engine. Custom fields capture context, automations enforce flow, and governance aligns teams.
You now triage faster, prioritize smarter, and close gaps reliably. Start with fields and one workflow; scale from there.
Security posture strengthens when findings become tickets. Book a Discovery Call with Bud Consulting to refine your setup.