
table of contents
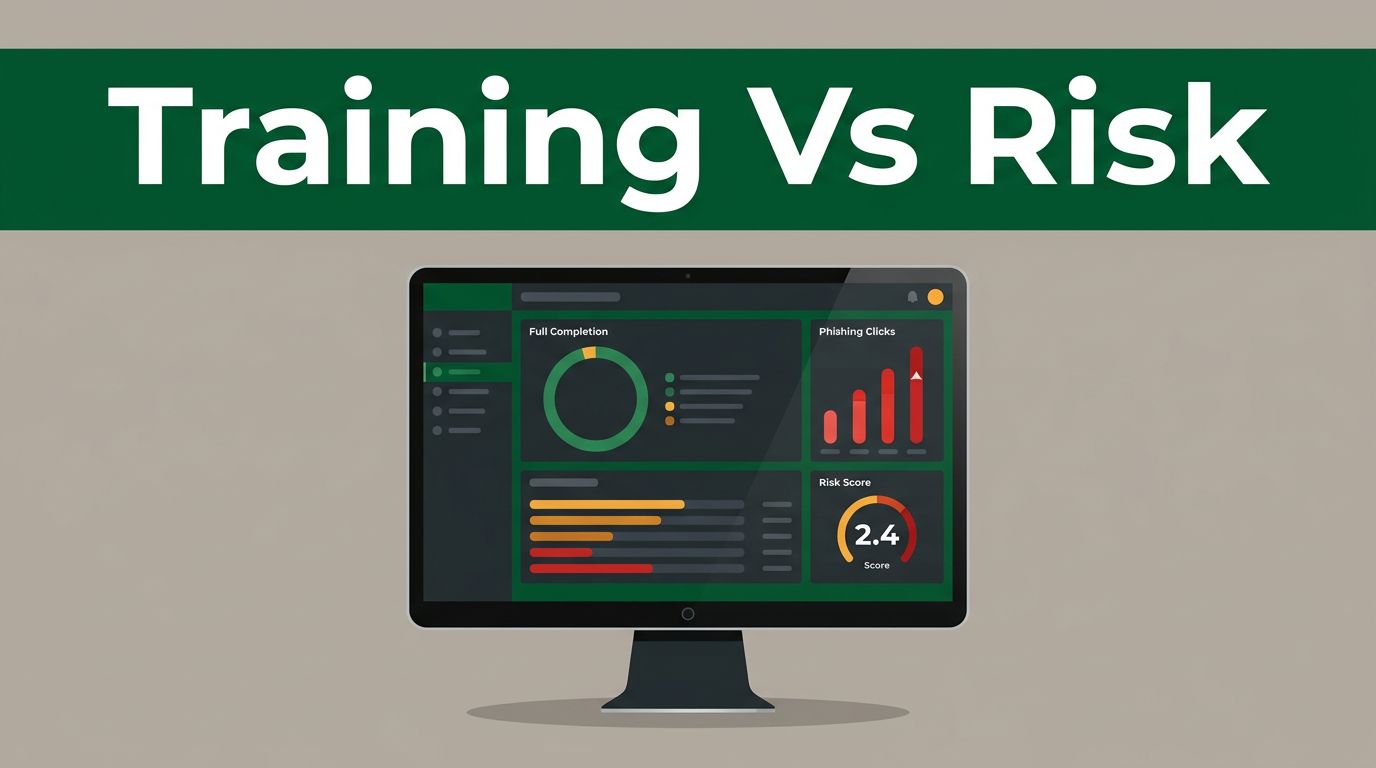
Security leaders often look at a 100 percent training completion rate and assume the organization is safe. Modern behavioral risk dashboards show a different reality, because finishing a course doesn’t mean employees stop clicking phishing links.
Key Takeaways
- Training completion metrics show who finished required modules, but they do not prove that security habits have improved.
- Behavioral risk dashboards aggregate phishing clicks, policy violations, and reporting rates into an individual risk score.
- Combining completion data with behavioral telemetry helps security teams target interventions where exposure is highest.
- Data privacy and responsible analytics practices prevent employee surveillance anxiety and protect organizational trust.
Distinguishing Completion Metrics from Behavioral Indicators
Training completion is a compliance metric. It answers a simple administrative question. Who finished the assigned course by the deadline? A standard platform tracks timestamps, department filters, and quiz scores to prove compliance for auditors.
Behavioral risk is an exposure metric. It tracks what employees actually do when faced with real security threats.

Many organizations rely solely on completion records because those numbers are easy to pull. An employee can pass an annual security quiz with a perfect score and still fall for a targeted credential harvest email the next morning.
Training completion proves attendance and policy acknowledgment. It does not measure human resilience against active cyber attacks.
What Behavioral Risk Dashboards Actually Measure
Behavioral risk dashboards gather signals from multiple security layers to evaluate human exposure. Instead of looking at a simple pass or fail status, these tools calculate dynamic risk scores based on observable actions.

Vendors like Proofpoint and Frame Security track several core signals. These platforms monitor phishing simulation click rates, real threat reporting frequency, repeated policy violations, and email interaction patterns.
| Metric Type | What It Measures | Primary Purpose |
|---|---|---|
| Completion Rate | Course progress and quiz pass rates | Fulfilling regulatory compliance requirements |
| Behavioral Risk Score | Phishing clicks, reporting rates, and hygiene | Identifying active human vulnerabilities |
A modern platform translates these operational inputs into a unified score for each department or individual. Security teams can learn more about how metrics like phishing report rates and incident response times provide clear evidence that your program is changing behavior by reviewing specialized industry frameworks.
Example Dashboard KPIs for Security Teams
Effective security programs track a balanced mix of administrative and behavioral metrics. Relying on just one category leaves blind spots in your risk posture.
- Learner Completion Rate: The percentage of assigned staff members who finished required modules and passed associated quizzes.
- Phishing Susceptibility Rate: The proportion of employees who interact with simulated malicious links or attachments.
- Threat Reporting Rate: The speed and volume at which employees report suspicious emails to the security operations center.
- Repeat Offender Count: The specific number of individuals who fail multiple phishing tests despite completing remedial training.
Tracking these indicators together allows security analysts to see which departments need immediate support. You can read about security awareness metrics that actually reduce breach risk to align your reporting with measurable outcomes.
Responsible Data Use and Privacy Guidelines
Tracking human behavior introduces serious privacy and trust challenges. Employees panic when they feel monitored or micro-managed by automated scoring tools.
Security leaders must establish clear boundaries for how risk telemetry is collected and displayed. Dashboards should anonymize individual scores when reporting to executive leadership, focusing instead on team trends and organizational exposure.
Never use behavioral risk metrics as a direct punitive tool. Punishing employees for clicking a clever simulation email destroys reporting culture. When workers fear disciplinary action, they stop reporting real suspicious emails.
Use high-risk scores as a trigger for supportive coaching rather than penalties. Pair metrics with targeted guidance so employees understand where their habits went wrong.
Acting on Trends Rather Than Punishing Individuals
Data collection is useless if the security team doesn’t act on the findings. When a dashboard highlights a department with high phishing susceptibility, deploy targeted micro-learning instead of generic organization-wide retraining.
If finance personnel struggle with invoice-themed lures, customize their simulations to match those specific vectors. If executives show low reporting rates, streamline the email reporting button to make action frictionless.
Organizations building mature human risk programs often benefit from external advisory support. To discuss how to measure and reduce human risk effectively in your environment, Book A Call With Us to review your current reporting capabilities.
Conclusion
Dashboards can track both training completion and behavioral risk, but they serve entirely different purposes. Completion metrics satisfy compliance checklists while behavioral indicators reveal actual operational exposure.
Security leaders must look beyond simple administrative checkboxes to measure true human resilience. Balancing clear metrics with privacy safeguards ensures your organization reduces risk without breaking employee trust.