table of contents
You know the frustration. You fill a role, but the new hire leaves after six months. Or costs skyrocket because job posts draw the wrong crowd. These issues drain time and budget. Hiring KPIs fix that. They turn gut feelings into clear data.
In April 2026, talent teams face picky candidates and tight budgets. Tech and cyber roles stay tough to fill. Track the right metrics, and you spot weak spots fast. You build stronger teams that stick. Let’s break down the KPIs that work.
Why Hiring KPIs Matter More Than Ever
Hiring changed in 2026. Skills rule over degrees. Companies pick for fit, not volume. Data from recent benchmarks shows top teams link recruiting to profits. They cut turnover by 20% with smart tracking.
Poor metrics lead to bad choices. You chase fast fills but get high churn. Good KPIs show the full picture. They guide tweaks in sourcing or offers. For example, one firm slashed costs 15% by ditching low-conversion job boards.
Focus on business impact. Retention ties to revenue. Speed matters, but quality wins long-term. Start with dashboards. Review weekly. Then adjust.
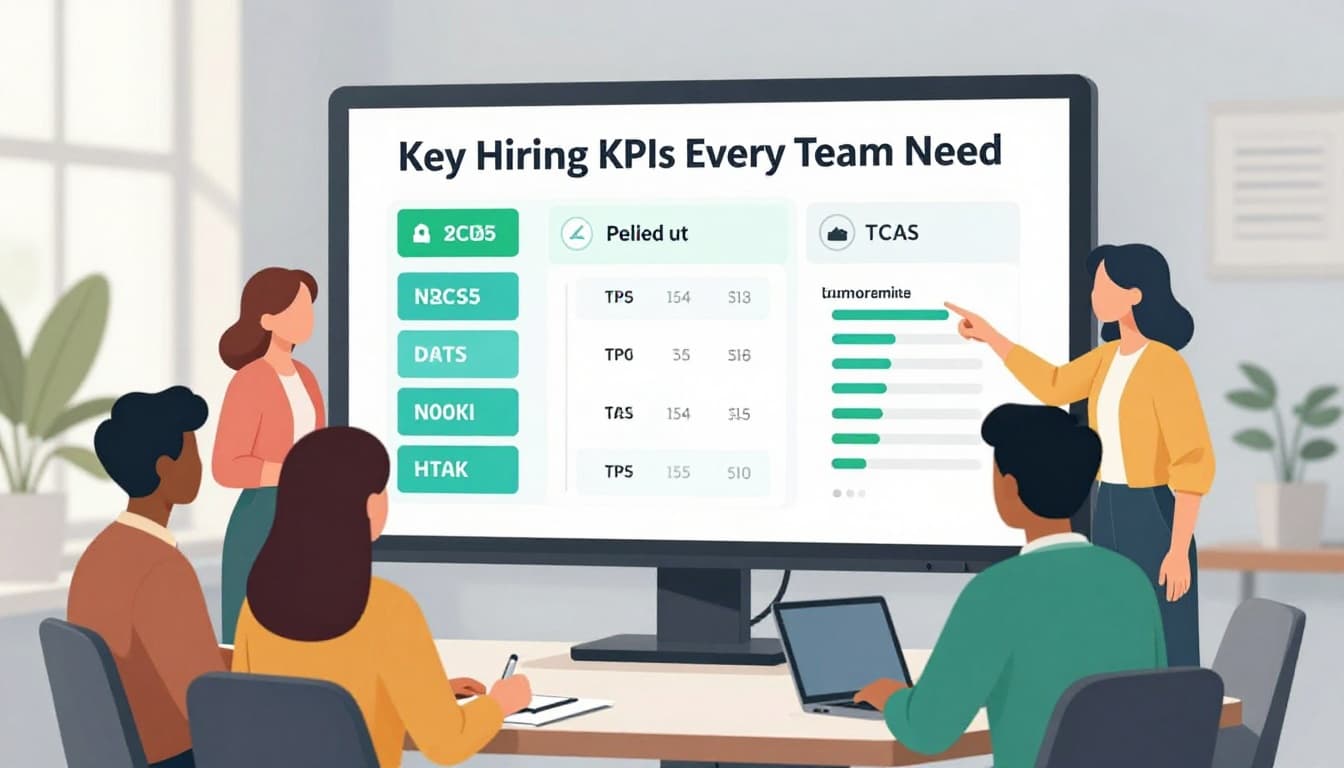
Core Hiring KPIs Every Team Needs
Pick five to ten KPIs. Match them to goals. Here’s what works across roles.
Quality of hire tops the list. It measures new hire success. Calculate as (performance score + retention months + manager rating) / 3. Use a 1-5 scale for each. Aim for 4 plus. Low scores signal screening flaws. High ones mean hires deliver.
Time to hire follows close. Count days from application to offer. Global average hit 38 days this year. Under 30 signals strong pipelines. Over 45? Check sourcing delays. For cyber engineers, target 29 days via referrals.
Cost per hire adds up quick. Divide total costs (ads, tools, staff time) by hires. Averages sit at $4,129. Tech roles range $800 to $4,500. Drops show efficiency gains. Spikes point to agency overuse.
Offer acceptance rate keeps it simple. Divide accepted offers by sent offers, times 100. Hit 80% or better. Below 75%? Candidates see better deals elsewhere. Speed offers to boost this.
Teams track these on shared dashboards. One points to trends. Others discuss fixes. Results follow.
First-year attrition rounds it out. Divide early leavers by total new hires, times 100. Keep under 15%. Higher rates hurt morale. Fix with better interviews.
Leading vs Lagging Hiring Indicators
Not all KPIs predict the future. Leading ones do. They flag issues early. Lagging ones confirm past results.
Time to hire acts as leading. Short times mean hot pipelines. Long ones warn of shortages. Watch by role. Cyber architects? Delays hit 45 days without niche sources.
Source conversion leads too. Divide hires from a channel by prospects from it, times 100. Aim for 2% outbound. Low rates waste ad spend. Shift budget fast.
Lagging KPIs like quality of hire show outcomes. Wait 90 days for scores. Retention lags more. Track at 12 months. Bad trends mean process overhauls.
Balance both. Leading guides daily tweaks. Lagging proves value to leaders. For instance, a recruiter spots low conversions. They test new boards. Quality rises three months later.

A recruiter eyes these daily. Clocks tick on time to hire. Icons glow for quality checks.
Candidate NPS leads experience fixes. Survey all. Scores over +50 build pipelines. Low ones chase talent away.
Benchmarks to Beat in 2026
Know the numbers. Compare your team.
| KPI | Formula | 2026 Benchmark | Good Trend Signals |
|---|---|---|---|
| Time to Hire | Days from apply to offer | 38 days median | Under 30; faster referrals |
| Cost per Hire | Total costs / hires | $4,129 average | Drops with internal sources |
| Offer Acceptance | Accepted / sent x 100 | 80-85% | Above 90%; quick decisions |
| Quality of Hire | (Perf + retain + rating)/3 | 4+/5 scale | Steady highs; skills tests help |
| First-Year Attrition | Leavers / hires x 100 | Under 15% | Declines; strong onboarding |
Data pulls from global recruiting benchmarks. Tech beats averages. Cyber needs clearance tracking. One extra: internal mobility at 15-30%.
These set targets. Beat them? You lead. Miss? Dig into causes.
For deeper dives, check top recruiting KPIs for 2026.
Tailor KPIs to Tech and Cyber Roles
Tech demands speed. Cyber adds clearance hurdles. Adjust metrics.
For devs, track sourcing channel effectiveness. Referrals fill in 29 days at $1,500 cost. Agencies hit $12,000. Quality of hire targets 88%. Low? Add skills tests.
Cyber pros ramp slow. Measure time to productivity. Under 90 days means solid training. Clearance rate matters. Track eligible candidates per source. Niche boards convert best.
Company stage shifts focus. Startups chase time to hire. Scales prioritize retention. Growth firms eye cost per hire.
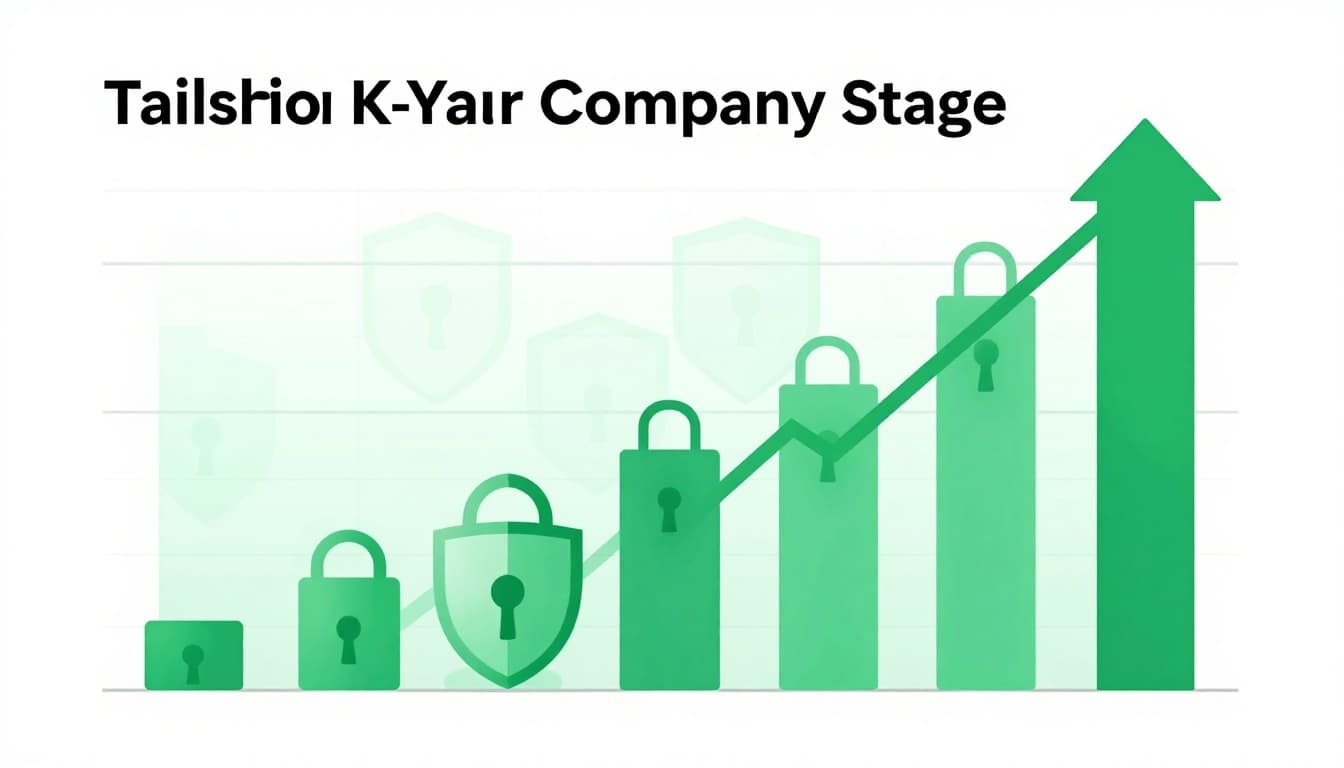
Charts climb with right focus. Locks guard cyber gains.
See 2026 recruiting metrics for TA for tech specifics.
Adapt KPIs to Your Company Growth Stage
Early stage? Speed fills gaps. Track time to fill most. Quality second.
Mid-growth? Balance cost and retention. Attrition over 15% kills momentum.
Enterprises stress diversity and NPS. Internal hires save 50% costs.
Pick three to five. Test for six months. Tweak based on data. Goals change. So should KPIs.
Bud Consulting helps cyber teams here. We source architects who stick.
Track these hiring KPIs today. Watch your teams strengthen. Which one will you start with? Share in comments. Or reach out for a metrics review.