table of contents
A hiring plan can look fine in January and still miss budget by April. That happens when headcount goals move faster than the numbers behind them.
Good recruitment budget forecasting gives you a working model, not a guess. It helps HR and finance see what each hire may cost, where spend will land, and which roles need extra room in 2026, especially for hard-to-fill technical and leadership jobs.
Start with the full cost picture, because the biggest budget gaps usually hide in small line items.
What recruitment budget forecasting must include
Most hiring budgets fail for one simple reason, they only count the obvious costs. Agency invoices and job ads are easy to spot. Recruiter time, software seats, assessments, travel, and pre-start costs often slip through.
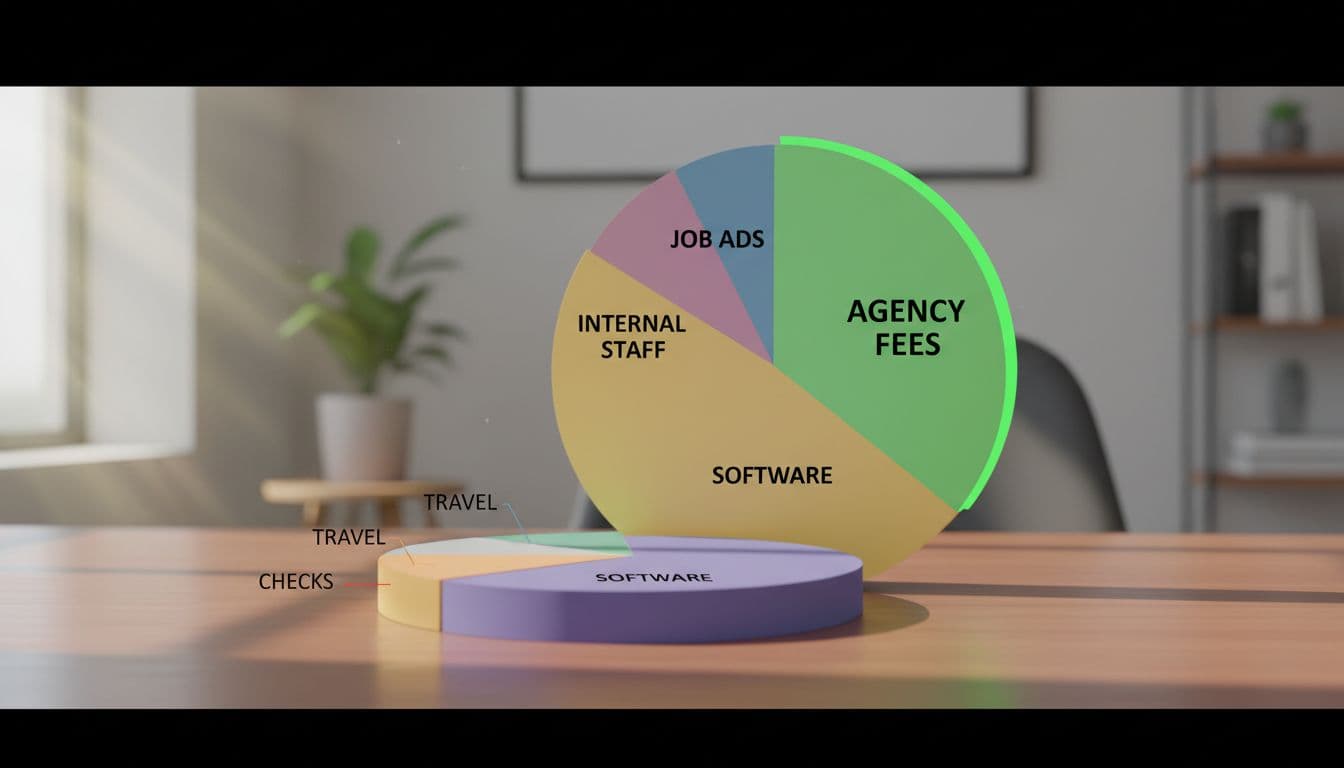
Start by splitting costs into internal and external buckets. Internal costs include recruiter salaries, benefits, employer taxes, sourcing time, coordination time, and hiring manager interview hours if you want a fuller model. External costs usually cover agency fees, job board spend, employer branding campaigns, recruiting software, candidate assessments, travel, background checks, and onboarding-related hiring costs such as equipment setup or pre-boarding admin.
For a wider view of common spend buckets, this recruiting budget guide is a useful reference point.
If the cost starts before day one, it belongs in the forecast.
That matters even more when roles vary by difficulty. A sales coordinator and a senior cloud security architect won’t share the same cost pattern. One may rely on direct applications and light screening. The other may need a search firm, niche ads, deep assessments, and finalist travel.
Cost-per-hire helps tie all of this together, but only if you use it well. Don’t rely on one company-wide average. Build cost-per-hire views by role family, seniority, or business unit. Benchmarking against outside data, such as these 2026 recruiting benchmarks, can also help test whether your assumptions are drifting too high or too low.
A step-by-step process for building the forecast
A strong forecast starts with demand, then turns that demand into realistic spending assumptions. Keep the model simple enough to update every month.

- Lock the hiring demand. Confirm approved roles, hiring timing, and target start dates by quarter. Separate growth hires from backfills, because each follows a different risk pattern.
- Group roles by difficulty. Put each opening into a hiring lane, such as standard, specialist, or executive. This one step makes the rest of the model much cleaner.
- Assign a likely channel mix. Estimate how many hires will come through internal recruiters, referrals, job ads, direct sourcing, or agencies. Hard-to-fill roles usually need a higher external spend and a longer time-to-fill.
- Add fixed and variable costs. Fixed costs include ATS, CRM, assessment tools, and employer branding retainers. Variable costs include ads, agency fees, checks, and travel. Then use a basic formula: total internal costs plus total external costs, divided by planned hires.
- Build low, base, and high scenarios. Finance teams trust ranges more than wishful thinking. A base case might assume normal fill rates. A high case can reflect more agency use, delayed fills, or extra interview travel.
Outside cost references can help pressure-test the model. This overview of the cost of hiring an employee in the United States is one example. Still, your own historical data should carry more weight than any generic benchmark.
A sample budgeting framework and how to work with finance
Once the model is set, translate it into a short framework finance can scan in minutes. Keep every line tied to a hiring assumption, not a vague estimate.

Here is a simple structure:
| Budget line | Forecast basis | Example assumption |
|---|---|---|
| Internal recruiters | FTE cost by req load | 2 recruiters, 80% allocated to hiring |
| Agency/search spend | % of roles using firms | 4 specialist hires at retained or contingency fees |
| Job ads and branding | Campaign plan by quarter | Niche boards, paid social, careers content |
| Software and assessments | Contract plus usage | ATS, CRM, interview tech, testing tools |
| Travel and checks | Per finalist or per hire | Flights, hotels, meals, background checks |
| Onboarding-related hiring costs | Per new starter | Equipment, admin, pre-boarding setup |
The takeaway is simple, fixed costs sit at the top, while variable costs rise and fall with hiring volume and role difficulty.
Now compare two cases. A company planning 20 mid-level hires may spend more on internal recruiter capacity, ads, and software, while keeping agency spend low. Meanwhile, a firm hiring six senior security engineers and one CISO may spend less overall on volume but far more per hire because search support, assessments, and travel all rise.
When you meet finance, bring three things: assumptions, ranges, and tradeoffs. Show what changes if hiring is pulled forward, frozen, or shifted to agencies. Also separate controllable spend from demand-driven spend. That makes budget reviews calmer and faster.
Finance doesn’t approve hope. It approves assumptions it can trace.
If you miss recruiter capacity, software renewals, or pre-start costs, the budget isn’t off by a little. It’s off at the base.
Build the forecast from hiring demand, role difficulty, and channel mix, then refresh it monthly. That turns recruitment budget forecasting into a tool leaders can trust, not a spreadsheet they argue with.
Pick one role family this week and model a low, base, and high-cost version. That small step usually changes the whole budget conversation.