table of contents
Picture this: an alert hits your SOC at 2 a.m. Your team scrambles, but by morning, the damage spreads. You wonder why detection took so long. Incident response metrics like MTTD expose these gaps fast.
You face pressure to respond quicker amid rising threats. Dashboards turn raw data into clear signals. They help teams spot issues before they escalate. This post covers the metrics that matter, dashboard designs for your roles, and tips to make them work.
Key Incident Response Metrics That Drive Decisions
Focus on metrics that reveal real problems. Start with time-based ones. Mean time to detect (MTTD) tracks how long threats hide. Aim for under 24 hours; top teams hit single digits.
Mean time to acknowledge (MTTA) measures alert response speed. Benchmarks sit at 5-10 minutes for critical alerts. Then comes mean time to resolve (MTTR), your full cycle from detect to fix. Keep it below 4 hours for high-priority cases.
Dwell time shows attacker stay duration. It’s often 11-21 days per recent reports. Cut it by tightening MTTD. Escalation rate flags handover issues; target under 20%. Containment and remediation times break down MTTR further.
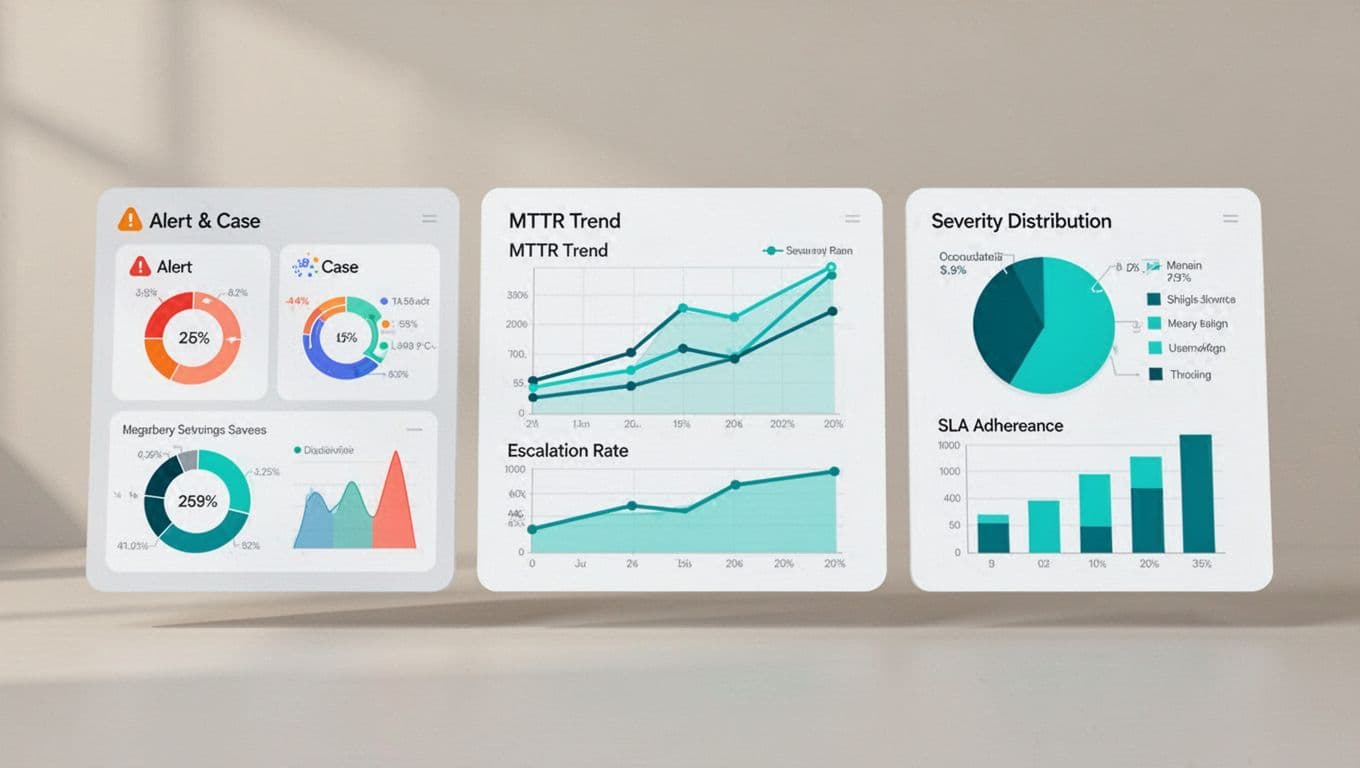
Severity distribution charts incident types. Most teams see 70% low, 20% medium, 10% high. Track SLA adherence too. False positive rates above 30% waste time, so monitor them closely.
Repeat incidents signal weak fixes. Alert-to-incident conversion below 5% means tuning rules. Backlog and case aging prevent pileups.

These picks beat vanity stats like total alerts. For details on MTTD and MTTR benchmarks, check Rootly’s guide to incident response metrics. They drive fixes, not finger-pointing.
Tailoring Dashboards for Different Teams
One dashboard fits no one. Customize views by role. Frontline analysts need real-time widgets: active alerts, case queues, false positives.
IR managers drill into trends. Show MTTR by team or severity, escalation rates, repeat incidents. SOC leaders watch efficiency: SLA hits, backlog size, conversion rates.
Executives want summaries. Severity pies, dwell time overviews, cost impacts. Filter by quarter for board talks.
Pull from SIEM for logs, SOAR for workflows, EDR for endpoints, ticketing for cases, threat intel for context. Tools like Microsoft Sentinel’s incident metrics workbook offer templates. Role-based access keeps it simple.
Pull Data from Your Security Stack
Dashboards shine with integrated feeds. SIEM provides alert timelines for MTTD calc. SOAR logs playbooks for containment time.
EDR endpoints feed dwell estimates. Ticketing tracks case aging and escalations. Threat intel adds severity weights.
Automate pulls to avoid manual errors. Use APIs for real-time updates. Segment by asset or region. This setup reveals patterns, like night-shift MTTR spikes.
For SOC examples, see Expel’s metrics dashboard template. It covers workload and detection accuracy.
Set Smart Thresholds and Benchmarks
Benchmarks guide you. MTTD under 24 hours suits most; mature SOCs target hours. MTTR below 4 hours for responses, per 2026 standards.
Dwell time goal: under 21 days. False positives stay below 30%. Escalation under 20%, SLA over 95%.
Set alerts for breaches: red if MTTR tops 6 hours. Green for trends improving 10% monthly. Compare against peers via NFLO’s SOC KPIs.
Review quarterly. Adjust for your stack and threats.
Pitfalls to Avoid in Your Dashboards
Too many charts overwhelm. Pick 8-10 key widgets max. Poor data quality skews everything; validate sources weekly.
Inconsistent definitions trip teams. Agree on MTTR scope upfront: detect to close, or just remediation?
Metrics for blame kill morale. Use them for process tweaks instead. Trends matter over single cases.
Overload hides signals. Fix by prioritizing. For more on traps, read Oneuptime’s incident effectiveness tips.
Conclusion
Strong dashboards hinge on focused incident response metrics like MTTD, MTTR, and dwell time. Tailor them to roles, integrate your tools, and dodge common traps.
Teams that track these see faster responses and fewer repeats. Start small: pick three metrics, build one view, iterate.
Need help scaling your SOC? Book a Discovery Call with Bud Consulting to close skills gaps.
(Word count: 982)