table of contents
You manage an engineering team in 2026. AI tools speed up coding. Cloud setups grow complex. Supply chain attacks hit headlines weekly. Yet breaches still happen because security feels like an afterthought.
Security metrics fix that. They show if your team’s work keeps risks low without slowing deployments. You get data to push back on bad practices or prove your program’s value to execs.
This guide picks metrics that matter. They tie to outcomes, not just busywork. You’ll see how to choose 5-10 core ones and build a dashboard that drives decisions.
Why Track Security Metrics in Today’s Engineering Teams
Engineering managers face pressure. Developers want fast releases. Security teams flag endless alerts. You balance both.
Good metrics cut through noise. They prove security boosts productivity, not hinders it. For example, high scan coverage spots flaws early, so fixes happen before production.
In 2026, threats shift. AI-assisted development hides model risks. Software supply chains carry vendor flaws. Cloud-native stacks misconfigure often. Metrics must cover these.
Focus on three types. Team health metrics track adoption and friction. Security outcome metrics measure real risk reduction. Compliance metrics handle audits but stay secondary.
Bad metrics mislead. “Number of scans run” ignores if anyone acts. Good ones like fix rate show progress. OWASP SAMM outlines this split: effort, results, environment. Start there for baselines.
Teams with strong metrics deploy safer. DORA research links them to elite performance. Your goal: attributable numbers you control.
Team Health Metrics That Drive Developer Buy-In
Developers ignore security if it slows them. Track adoption to change that.
First, developer adoption rate. Formula: (developers using security tools / total developers) x 100. Aim for 90%+. Bad example: “Training sessions held.” It counts events, not skills gained. Good: Track pull requests with security checks.
Security integration friction score works next. Measure build time increase from scans. Target under 5% slowdown. If scans add 10 minutes per PR, productivity drops.
Security champion engagement tracks volunteers fixing issues. Count monthly contributions per champion. Low numbers mean forced compliance fails.
These metrics stay hard to game. They link to daily work. In platform engineering, tie them to self-service portals. Developers fix issues themselves.
False positive rate matters too. (False alerts / total alerts) x 100. High rates (over 50%) kill trust. AI triage tools cut this in 2026.
Use these to spot friction. Low adoption? Simplify tools. Teams hit 85% adoption when scans run in seconds.
Security Outcome Metrics That Reduce Real Risk
Outcomes beat activities. Track what escapes to production.
Vulnerability escape rate tops the list. (Vulns in prod / total vulns found) x 100. Target under 5%. AppSec teams hit this with pre-merge gates. See benchmarks in AppSec Metrics That Matter.
Mean time to remediate (MTTR) follows. Time from detection to fix. Break by severity: critical under 3 days, high under 7. Median beats mean; outliers skew it.
Fix rate shows momentum. (Vulns fixed / vulns opened) per sprint. Above 1.0 clears backlog. Top teams reach 1.3.
In AI dev, add auditability of decisions. Percent of AI outputs reviewed. Low visibility hides prompt injection risks.
These metrics attribute to teams. A service with rising escape rate flags weak code reviews. Google SRE uses similar for error budgets.
Pair with DORA: change failure rate. Security fixes lower it. Your dashboard shows tradeoffs.
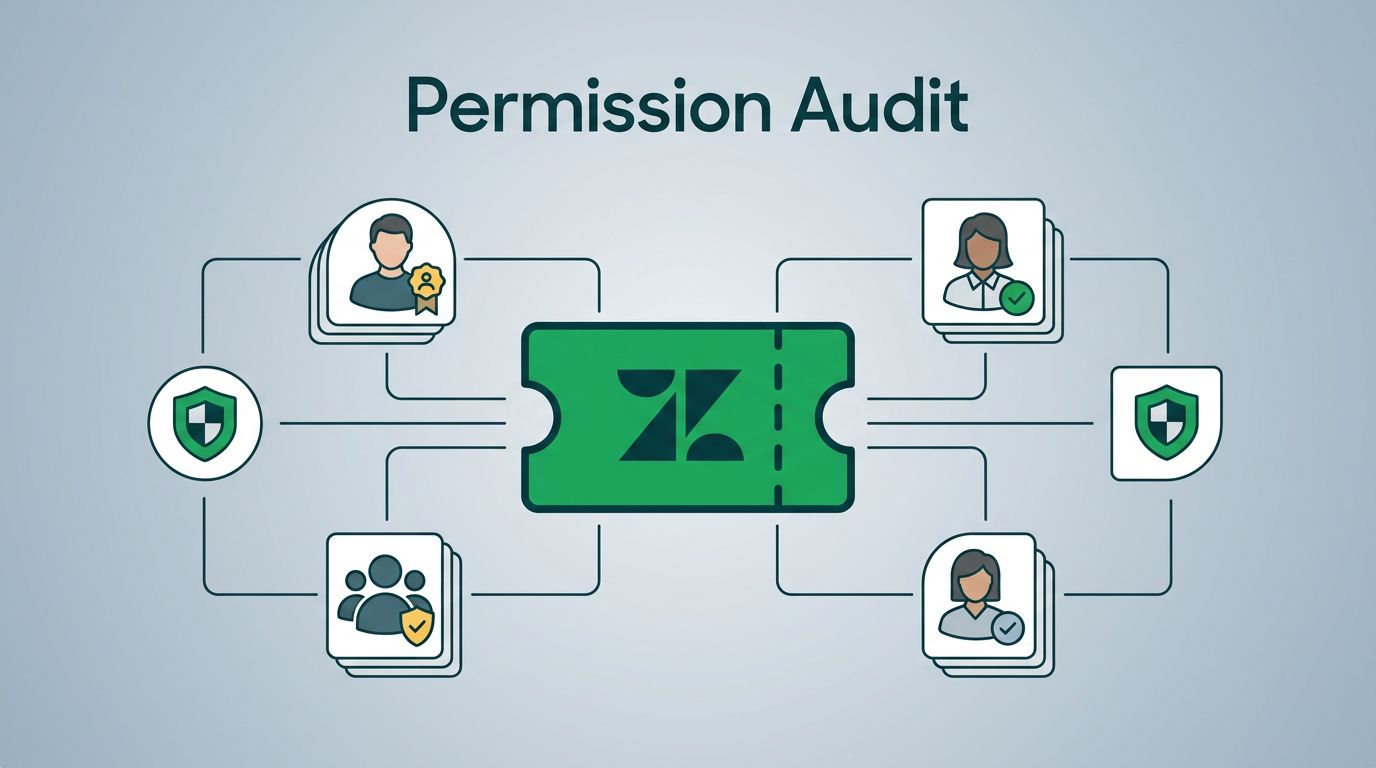
Metrics for Software Supply Chain Risks
Supply chains cause most breaches now. Open source dominates codebases. Track dependencies closely.
Software bill of materials (SBOM) coverage first. (Repos with SBOM / total repos) x 100. CISA pushes this; aim for 95%. Generate in CI, validate vendors.
Average vendor security rating. Score partners on CVEs, patches, certifications. Use tools for automated checks. Target average over 80/100.
Dependency freshness. (Outdated packages / total) x 100. Update weekly; stale ones carry known exploits.
Mean time for vendor incident response. Days from report to patch. Track top 20 vendors.
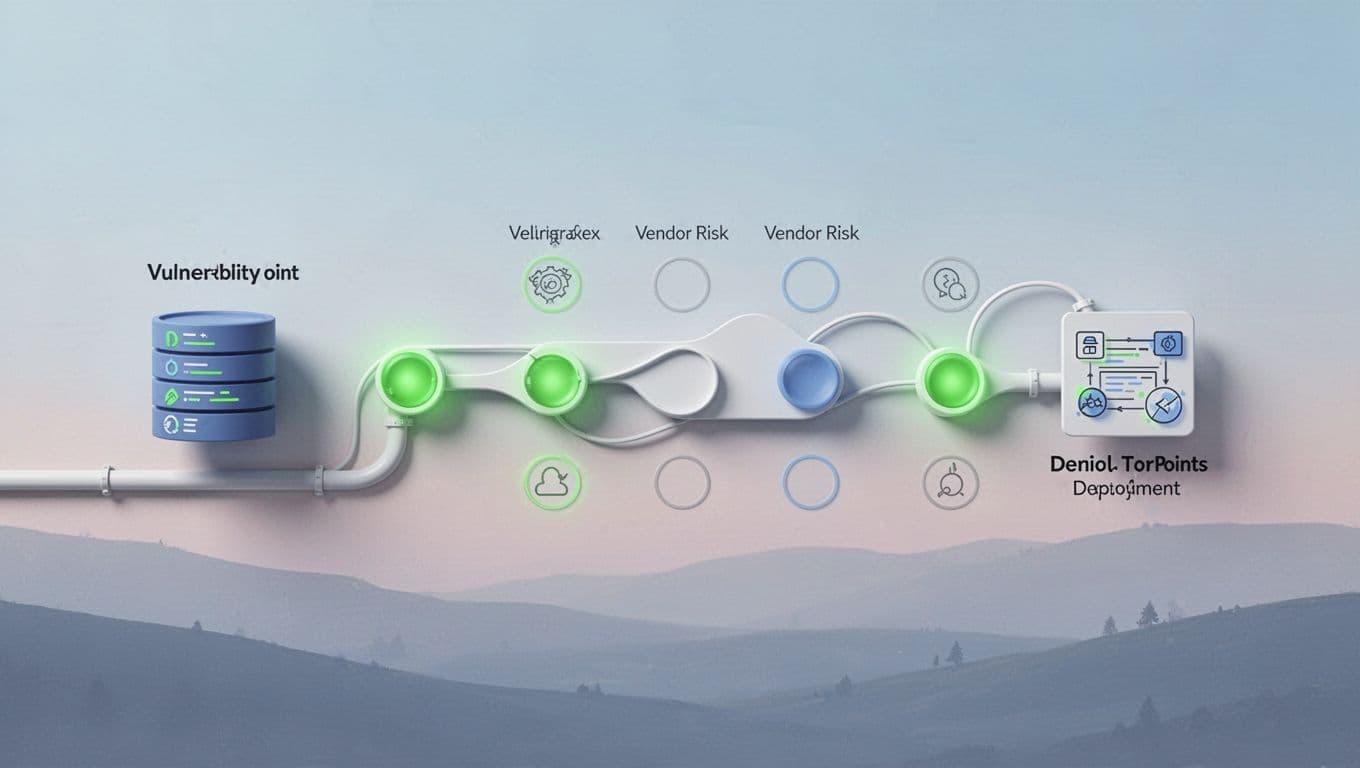
This image shows a typical pipeline. Nodes highlight where metrics catch risks.
Bad metric: “Packages scanned.” It misses if scans block deploys. Good: Fix rate for supply chain vulns.
NIST SP 800-218 recommends these in secure dev frameworks. In 2026, regulations mandate SBOMs. Your metrics prove compliance and cut risk.
Teams reduce escapes 40% with these. Review quarterly with vendors.
Security in Cloud-Native and Platform Engineering
Cloud-native amps risks. Kubernetes misconfigs topped 2025 incidents at 28%. Platform teams own fixes.
Infrastructure config failure rate. (Failed tests / total tests) x 100. Run in IaC pipelines. Target under 5%.
Endpoint detection coverage. (Systems with EDR / total) x 100. Cover clusters, nodes, workloads. Near 100% stops lateral moves.
Runtime escape rate. Vulns detected post-deploy. Use Falco or similar for behavioral checks.
In platform engineering, track self-service security. Percent of platforms with built-in policies.

Teams like this integrate scans naturally.
CNCF surveys note security lags culture shifts. Metrics bridge that. Google Cloud applies SRE to these, using SLOs for config drift.
These tie to productivity. High coverage means fewer outages, faster restores.
A Simple Framework to Select Your Core 5-10 Metrics
Pick metrics that fit your risks. Start with goals.
Step 1: List priorities. AI dev? Supply chain? Cloud? Rank by breach potential.
Step 2: Map to types. Two team health, three outcomes, two compliance.
Step 3: Check attributes. Actionable (you fix it)? Attributable (team owns)? Hard to game?
Step 4: Baseline and target. Use industry data.
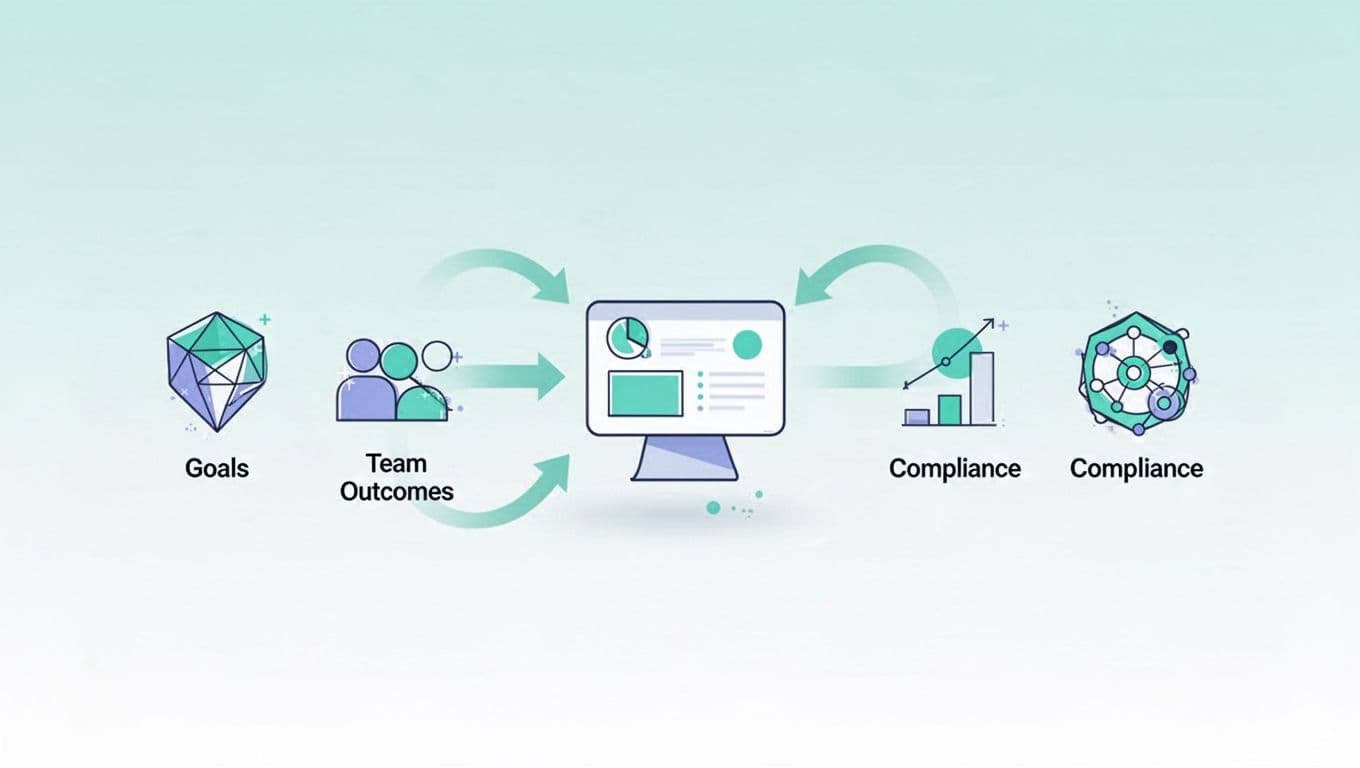
This diagram outlines the process.
Core set example:
| Metric | Type | Formula | Target |
|---|---|---|---|
| Developer Adoption | Health | Users / Total x 100 | 90% |
| Escape Rate | Outcome | Prod Vulns / Total x 100 | <5% |
| MTTR Critical | Outcome | Median Days to Fix | <3 |
| SBOM Coverage | Supply Chain | Repos with SBOM / Total x 100 | 95% |
| Config Failures | Cloud | Failed / Total Tests x 100 | <5% |
| Fix Rate | Outcome | Fixed / Opened | >1.0 |
| EDR Coverage | Cloud | Covered / Total x 100 | 100% |
| Vendor Rating Avg | Supply Chain | Score Average | >80 |
Add two more if needed. Review monthly. Adjust based on trends.
NIST’s measurement guides back this. It keeps you focused.
Building Your Metrics Dashboard
Dashboards make metrics live. Build one teams check daily.
Pick tools like Grafana or Datadog. Pull from GitHub, scanners, cloud APIs.
Group by category. Health on top, outcomes below. Add trends, not snapshots.

A manager reviews trends like this.
Set alerts. Escape rate over 5%? Ping the team. Share weekly with leadership.
Start small: MTTR, escape rate, coverage. AquilaX notes three suffice early. Mature to 10.
Tie to OKRs. Low MTTR earns deploy freedom. Teams love it.
For complex setups, segment by service. Platform teams get their view.
If gaps persist, book a discovery call with Bud Consulting. They help close security skills holes.
Conclusion
Security metrics turn vague risks into clear actions. Pick outcome-focused ones like escape rate and MTTR. They show your team ships safe code fast.
Build the framework. Dashboard it. Watch trends improve.
In 2026, these keep breaches at bay. Your engineers stay productive. Leadership sees proof.
(Word count: 2487)