table of contents
Your board wants to know if cybersecurity protects the business. They don’t care about firewall logs or patch counts. They need metrics that show risk exposure and recovery speed in dollars and days.
Boards face pressure from investors and regulators. In 2026, 94% of companies discuss cyber risks at the board level, yet many still use vague reports. You can fix that with clear board-level security metrics focused on business outcomes.
This guide shows you how to pick metrics that drive decisions. Start with trends that tie security to revenue and operations.
Start with Business Risks, Not Tech Details
Boards oversee strategy. They track metrics that link cyber threats to financial loss. For example, show the potential cost of a ransomware hit or data breach.
Focus on material risk exposure first. Calculate the likelihood of key events times their financial impact. If a breach could cost $10 million with a 20% chance this year, that’s $2 million in expected loss. Track this quarterly.
Incident trends come next. Report volume by severity and business unit. Did finance see more phishing? Link it to downtime costs.
Detection and response performance matters too. Use mean time to detect (MTTD) and mean time to recover (MTTR). Aim for MTTD under 24 hours and MTTR under 72 hours. These predict operational downtime.
Skip raw counts like “1,000 alerts blocked.” Translate them: “Blocked threats avoided $500,000 in losses.” Boards grasp that.
Pick Metrics That Show Control Coverage
Controls prevent breaches. Boards need proof they work across assets.
Track percent of critical assets with multi-factor authentication (MFA). Target over 98%. Low coverage means easy account takeovers.
Control coverage extends to data. Measure percent of sensitive data classified and inventoried, above 95%. Unseen data invites leaks.
Third-party risk fits here. Report vendors with security SLAs, over 90%, and those with current SOC 2 Type 2 reports. Supply chain failures hit headlines.
For resilience, monitor recovery readiness. Test backup restore times quarterly. Show success rates above 95%.
These metrics build trust. They prove gaps close over time.
Build a Sample Board Security Dashboard
Dashboards condense info into one page. Use four to six visuals with trends and targets.
Here’s a simple structure:
| Metric Category | Key Metric | Target | Q1 2026 Trend |
|---|---|---|---|
| Risk Exposure | Expected financial loss | <$5M | Down 15% |
| Incident Trends | High-severity incidents | <5 | Flat |
| Response Speed | MTTD / MTTR (hours) | 24/72 | MTTD: -10% |
| Control Coverage | MFA on critical assets | >98% | Up 2% |
| Third-Party | Vendors with SLAs | >90% | Steady |
| Investment ROI | Cost per avoided incident | <$10K | Improving |
This table sets context. Green for on-track, red for issues. Add one-sentence explanations below each chart.

Visuals like this dashboard keep eyes on priorities. For more examples, check NACD’s cybersecurity board reporting toolkit.
Track Vulnerability Remediation by Criticality
Vulnerabilities pile up fast. Boards care about high-risk ones that attackers exploit.
Prioritize by CVSS score. Track time to remediate critical vulns (days old >30: under 5%). Medium and low follow.
Report trends: “95% of critical vulns fixed in 14 days, down from 21 last quarter.” Tie to exposure: “10 critical vulns open could allow ransomware entry.”
Leave patch counts for ops teams. Boards want business risk reduced.
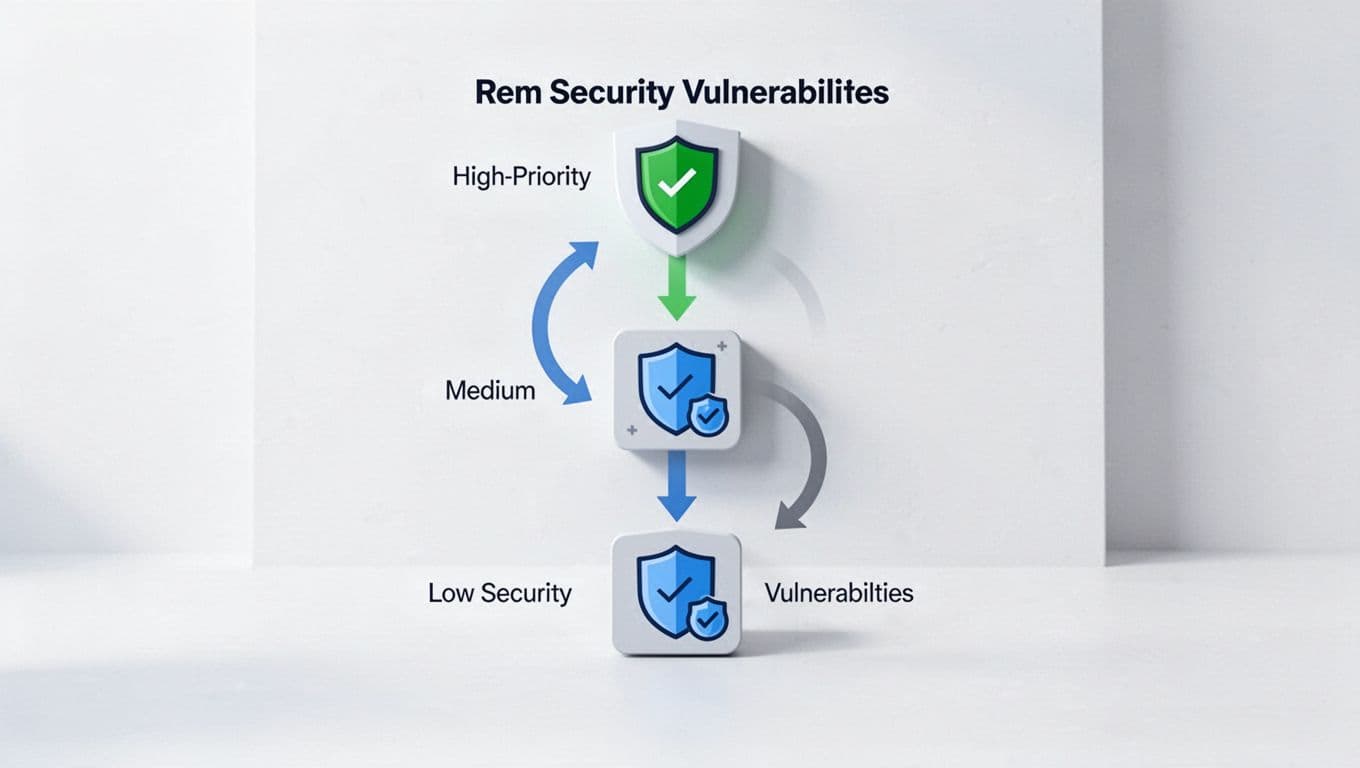
This visual shows flow. It highlights why speed on critical items prevents breaches.
Measure Security Investment Effectiveness
Budgets rise, but boards ask for proof. Show ROI with cost per avoided incident or breach probability reduction.
Compare spend to outcomes. If $2 million in tools cut expected loss by $10 million, that’s a 5x return.
Use scenarios: “Without new EDR, MTTR doubles to 144 hours, costing $1M extra downtime.”
Track insurance optimization too. Show coverage gaps filled by controls.

This balance captures ROI. For details on financial exposure metrics, see Kovrr’s board reporting guide.
Leave Operational Metrics Off the Board Deck
Not all data belongs at board level. Keep phishing click rates or alert volumes in SOC reports.
Translate first. “Phish fails dropped to 2%, avoiding 50 potential compromises worth $200K.”
Raw MTTD by tool? No. Aggregate to business impact.
This keeps decks concise. Boards get 10 minutes per topic.
Meet 2026 Governance and Disclosure Rules
SEC rules demand material incident disclosure in four business days via Form 8-K. Annual reports cover risk management and board oversight.
Metrics help comply. Track regulatory readiness: percent of incidents assessed for materiality in 24 hours.
In 2026, AI risks join ransomware. Monitor non-human identities and AI model audits.
Details in the SEC’s cybersecurity guidance. These rules push clear metrics.
Key Takeaways
Strong board-level security metrics focus on exposure, response, and ROI. They reduce risk and meet regs.
Build your dashboard around business impact. Test it in committee first.
Ready to strengthen reporting? Book a Discovery Call with Bud Consulting for tailored advice on security leadership.
(Word count: 982)