table of contents
A human risk board report can look busy and still miss the point. Boards do not need a dump of training numbers or phishing stats. They need to see where people create exposure, whether risk is moving, and what decision is needed next.
The best reports turn behavior into business language. They connect human risk to fraud, outages, compliance findings, and control gaps. Then they end with a clear ask, not a pile of metrics.
What the board needs from a human risk report
A board deck should answer four questions fast. What changed? Why does it matter? What is the business effect? What do you want approved?
That means the report must strip out noise. Raw completion rates can help, but they rarely tell the story alone. Boards want to know whether risky behavior is concentrated in a business unit, tied to a control weakness, or getting worse after a campaign.
NACD’s cybersecurity board reporting examples are a useful reference because they focus on oversight, not activity. Use that same approach for your human risk board report. Keep the language plain, and tie each metric to a decision.
A board-ready template that keeps the story tight
A strong template keeps the deck short and predictable. If every quarter looks different, the board has to relearn the format each time. That slows the conversation.
| Section | What it should answer | Board-friendly output |
|---|---|---|
| Executive summary | What changed since the last report? | Three bullets and one decision point |
| Risk trends | Is human risk rising or falling? | A 12-month line chart and short interpretation |
| KPI snapshot | Where are the biggest behavior gaps? | A red, amber, green view by metric |
| Business impact | What has this cost or exposed? | A plain-language statement tied to operations, compliance, or finance |
| Recommended actions | What needs to happen next? | Owner, date, and expected risk reduction |
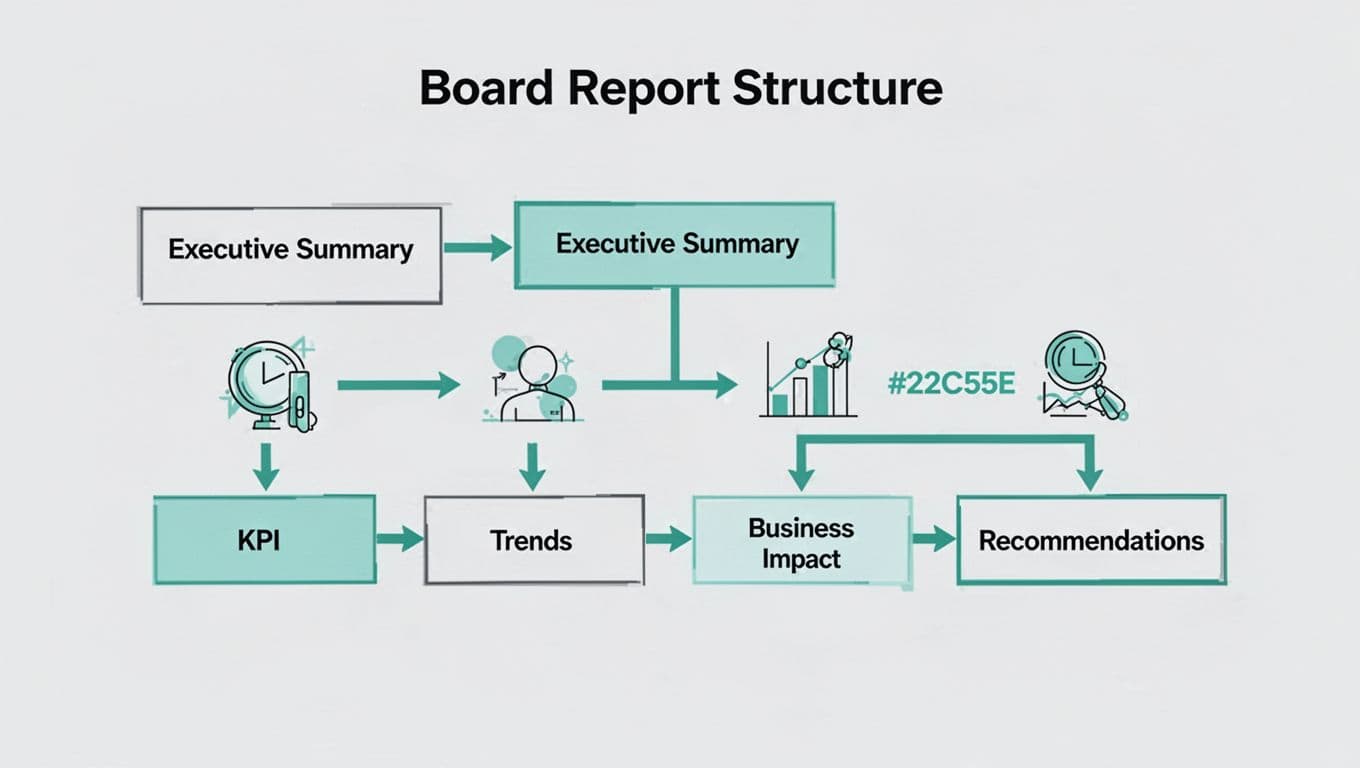
That structure works because it moves from status to meaning, then to action. It also keeps the report from turning into a training update.
A simple flow chart can help executives see the logic at a glance.
Metrics that deserve a place in the deck
Use metrics that show behavior, concentration, and change. A long list of counts won’t help the board decide anything.
| Metric | Why it matters | How to frame it |
|---|---|---|
| Phishing susceptibility rate | Shows direct exposure to social engineering | “Down 4 points over two quarters, but finance remains above average.” |
| Report rate for suspicious emails | Shows whether staff escalate threats quickly | “Improved after refresher training, yet some teams still under-report.” |
| Training completion within SLA | Shows program discipline and control coverage | “Completion is high, but late completion clusters in two regions.” |
| Repeat failure rate | Shows where one-off training is not enough | “A small group drives most failures and needs targeted coaching.” |
| High-risk user group score | Shows concentration of risk in sensitive roles | “Privileged, finance, and executive groups carry the highest exposure.” |
| Policy exception volume | Shows governance drift | “Exceptions rose after a new tool rollout and need review.” |
Use a line chart for trend, a heat map for business units, and a short table for exceptions. That mix is enough for most board meetings. For a broader view of how teams measure behavior, measuring human risk in cybersecurity offers a useful starting point.

How to turn numbers into decisions
Trend lines matter more than single-month results. A flat result can still hide a rising problem in one team, one site, or one role. So describe the pattern, then explain the driver.
Benchmarks help, but only when they are relevant. Internal history should come first, because it shows whether your program is improving. External benchmarks can add context, especially if they come from a trusted peer set. Benchmarking your cybersecurity program in 2026 is a good reminder to compare like with like.
Business impact is where the report gets real. Say how human risk connects to fraud, service disruption, audit findings, or extra analyst time. For regulated firms, that link matters even more. Cyber awareness KPIs regulators expect now shows how oversight language is shifting toward proof of effective behavior, not just completed training.
Keep the recommendation section short and direct. Each action should name an owner, a deadline, and the risk it reduces. If you need help shaping that story for executives, Book a Discovery Call with Bud Consulting.
A board report works when it moves past activity and into judgment. It should show where people are creating exposure, what that means for the business, and which action will reduce the risk next.
The strongest human risk board report is short, specific, and tied to decisions. That is what leaders can use.