table of contents
You run security awareness programs, but executives ask for proof it pays off. They want numbers that link training to lower risks and saved costs. Dashboards turn raw data into clear stories.
These tools show completion rates next to breach cost savings. They help you spot weak departments and justify budgets. Let’s build one that executives trust.
Why Security Leaders Need ROI Dashboards Now
CISOs face tight budgets in 2026. Boards demand evidence that training cuts human error risks. Dashboards provide that proof at a glance.
Consider phishing attacks. They cause 90% of breaches because employees click bad links. A good dashboard tracks click rates dropping after training. It also shows cost savings from fewer incidents.
You benchmark against peers too. Tools like Proofpoint’s CISO Dashboard reveal industry averages. Your program beats them? That’s your pitch.
Dashboards save time on reports. Automate updates so you focus on fixes, not spreadsheets. Execs see trends and nod approval.
Core Elements of an Effective ROI Dashboard
Start with scorecards for big-picture KPIs. Place training completion rate front and center. Add phishing simulation scores right below.
Next, include a risk score widget. Calculate it as (failed phish rate x impact weight). Tie it to business units for relevance.
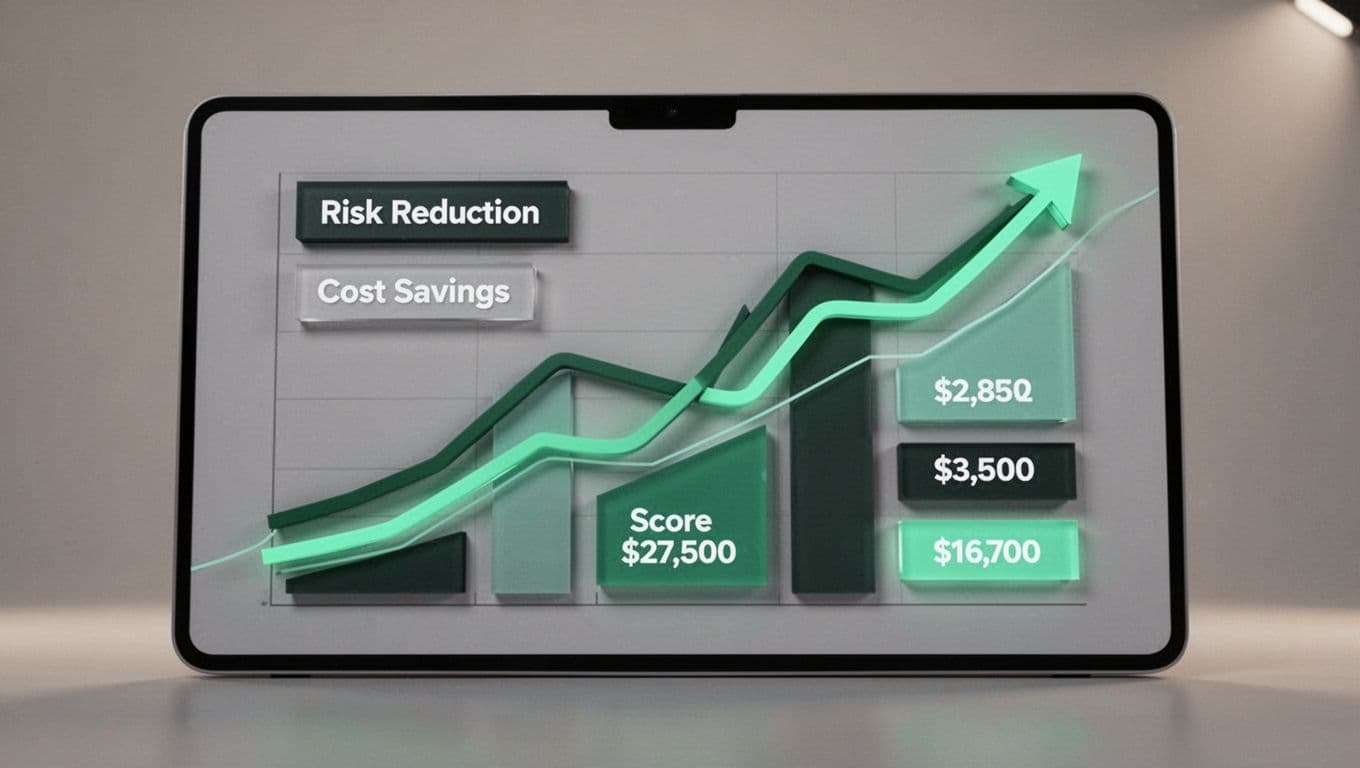
Cost savings get their own gauge. Formula: (pre-training incident costs – current costs) minus program expenses. Update monthly.
Build in filters for departments or roles. Sales teams click more? Flag it early.

This setup works because it answers “What’s the return?” fast. Execs scan in seconds. You drill down for details.
Key Metrics That Link Training to Business Value
Focus on behavior changes, not just completions. Track phishing click rates over time. Aim for under 10% after six months.
Reporting rates matter too. Employees who report simulations build a proactive culture. Target over 30%.
Risk reduction scores combine these. Formula: Baseline risk score minus current score, divided by baseline. Multiply by 100 for percentage drop.
Cost per prevented incident seals the deal. Estimate: Average breach cost times reduced vulnerability probability.
| Metric | Formula | Target Benchmark |
|---|---|---|
| Phishing Click Rate | (Clicks / Deliveries) x 100 | <10% |
| Reporting Rate | (Reports / Simulations) x 100 | >30% |
| Risk Score Drop | (Baseline – Current) / Baseline x 100 | 20-40% yearly |
| ROI Ratio | (Savings – Costs) / Costs x 100 | >300% |
These numbers tie training to dollars. For example, a 25% click rate drop might save $500K in breach avoidance. Source data from Adaptive Security’s reporting insights.
Formulas for Reliable Security Training KPIs
Keep calculations simple and transparent. Completion rate: (Completed modules / Assigned) x 100. Track time-to-complete too; under 7 days signals engagement.
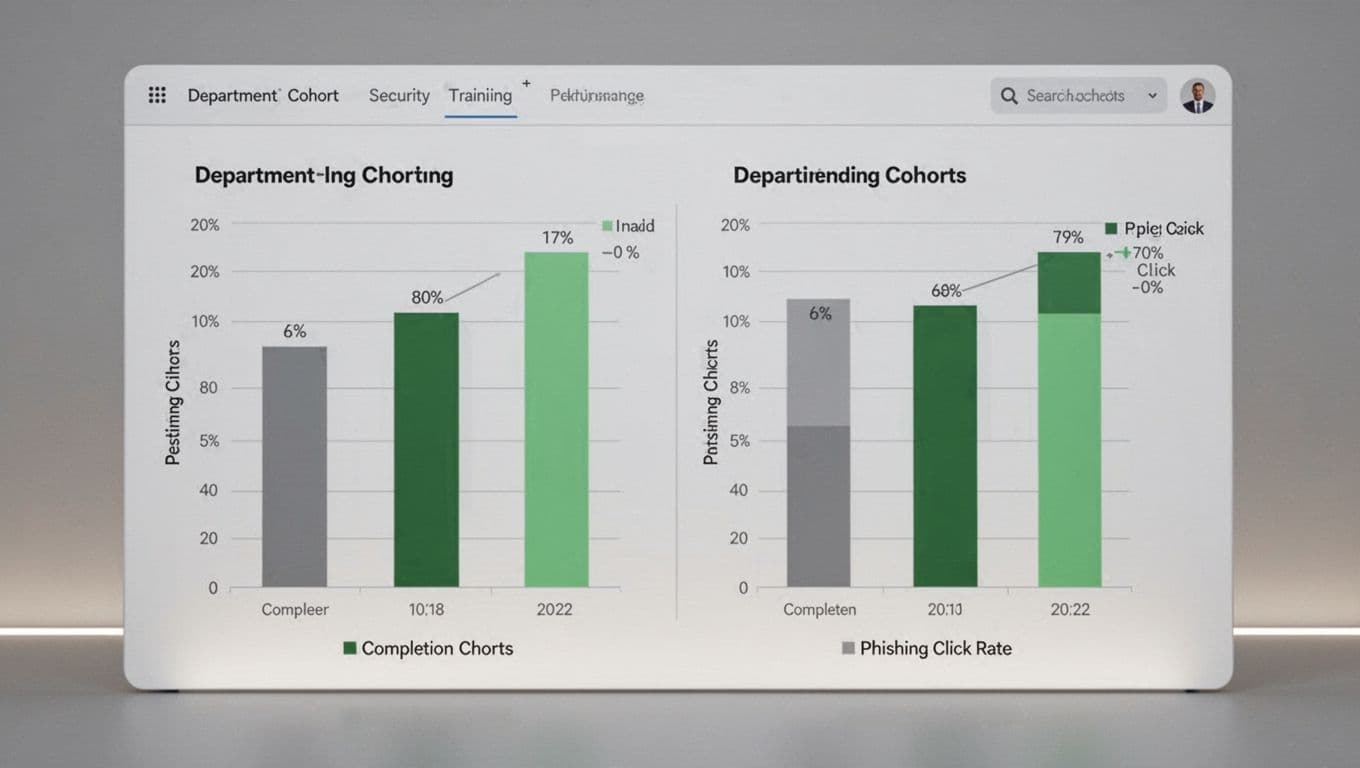
Phish fail rate by cohort: Segment new hires versus veterans. Formula: Failures per group / Simulations per group.
Tie to ROI directly. Total program cost includes software, admin time, and employee hours. Savings: (Incident frequency pre x cost per incident) minus post-training equivalent.
Avoid estimates; use historical data. Pre-training, your firm had 15 phish incidents yearly at $50K each. Post-training, down to 5? That’s $500K saved.
Benchmark with ISA Cybersecurity’s top KPIs. They list repeat offender rates under 5%.
Test formulas in tools like Tableau or Power BI. Audit them quarterly for accuracy.
Visualizations That Make ROI Crystal Clear
Trend lines shine for progress. Plot click rates monthly; green lines up mean success.
Scorecards use gauges or bullets. Show ROI as 4:1 ratio with color codes: green over 3:1.
Cohort bars compare groups. Finance at 95% completion, marketing at 75%? Assign targeted modules.
Heat maps flag high-risk users. Red for repeat clickers; intervene fast.
These visuals work because boards love them. A line from 35% clicks to 12% tells the story. Pair with PhishSkill’s ROI measurement tips.
Steer Clear of Vanity Metrics in Your Dashboards
Completions look good but lie. Everyone finishes? Doesn’t mean they learned.
Likes on training videos? Fun, but ignore them. Focus on applied behavior.
Repeat offenders matter more than average scores. Track top 5% risk users separately.
Always ladder up to business impact. Does training cut dwell time? Link to MSSP Security’s effectiveness metrics, where shorter detection saves millions.
Test dashboards with execs. If they ask for sources, you win.
Tie It All to Risk Reduction and Executive Buy-In
Dashboards prove training shrinks attack surfaces. Lower clicks mean fewer breaches.
Benchmark against peers via Secnap’s ROI examples. Your 400% return beats their average.
For stuck programs, book a discovery call with Bud Consulting. They help build culture and fill gaps.
Key Takeaways
Strong dashboards show security training ROI through trends and savings. Pick metrics like click rates and risk drops.
Build with scorecards, lines, and cohorts. Avoid fluff; chase business wins.
Your board sees the value. Funding follows. Start tracking today.