table of contents
Phishing attacks cost companies an average of $4.8 million per breach. You run simulations to cut that risk, but executives want proof it pays off. Click rates drop fast with training, from 33% to under 5% in a year, yet those numbers alone don’t show phishing simulation ROI.
Security teams track behavior changes, but true value comes from linking simulations to fewer incidents and lower costs. This guide breaks down actionable metrics, formulas, and examples. You’ll see how to tie results to business wins.
Ready to build a case for your program? Let’s start with the right metrics.
Core Metrics That Reveal Phishing Simulation Value
Click rates grab attention, but they miss the full picture. Focus on reporting rates and repeat failures instead. These show if employees spot and act on threats.
Untrained teams click 33-34% of simulations. After 90 days of monthly tests, that falls to 18-20%. By year one, top programs hit 4.6% or less. Reporting jumps from 5% to over 30%, turning staff into your first defense line.
Track these alongside:
- Phish-prone percentage (PPP): Users who click and submit data.
- Time to report: Minutes from email arrival to first flag.
- Repeat offender rate: Failures over multiple campaigns.
Productivity gains matter too. Simulations take 21 seconds per click on average, but trained users report faster. This cuts incident response time by hours per event.

Over six months, click trends like this prove progress. Risk drops as ROI climbs. Tie metrics to real outcomes, like 86% fewer infections in trained groups.
Simple Formulas to Quantify Your ROI
Start with expected loss avoidance. Estimate annual breach risk, then factor in simulation impact.
Basic formula:
ROI = (Risk Reduction – Program Cost) / Program Cost × 100%
First, calculate baseline risk. If a phishing breach costs $4.8M and your PPP is 33%, expected annual loss might hit $1.6M for a mid-size firm. Simulations cut PPP by 70%, so you avoid $1.12M.
Subtract costs: $20K annual subscription plus $5K admin time equals $25K. ROI = ($1.12M – $25K) / $25K = 4,400%.
Here’s a benchmark table for quick reference:
| Company Size | Avg. Program Cost/Year | Typical Risk Reduction | Sample ROI |
|---|---|---|---|
| Small (50-200) | $2K-$10K | 50-70% | 69-200% |
| Mid-Market (500-2K) | $20K-$50K | 70-80% | 500-600% |
| Enterprise (5K+) | $100K+ | 80-90% | 276-1,225% |
Data draws from Forrester’s TEI study and similar reports. Adjust for your breach cost and PPP drop. For details on gain calculations, check this Infosec Institute example, which shows 500% ROI from $240K avoided losses.
Assumptions include steady training. Test over 12 months for reliable numbers.
2026 Benchmarks for Phishing Simulations
Current data sets clear targets. Global baselines sit at 33.1% clicks for untrained users. Tech sectors hit 10-20%; healthcare lags at higher rates.
After training:
- 90 days: 40% drop to 20%.
- 12 months: 86% overall reduction.
AutoPhish benchmarks note phish-prone rates fall to 4.6% with simulations. Reporting rates climb to 21-30%, key for ROI.
AI phishing boosts clicks to 54%, so match sims to real threats like SMS (25.7% baseline). Monthly campaigns across channels yield best results. Compare your rates quarterly. If above 5% PPP, ramp up targeting for high-risk roles.
These numbers link directly to savings. Firms see 46x fewer malware hits.
ROI in Action: Examples by Company Size
Small teams keep it simple. A 100-person firm spends $5K yearly. PPP drops from 30% to 10%, avoiding $200K in breach costs. Net ROI: 3,900%.
Mid-market scales up. 1,000 users at $40K cost. Simulations cut incidents by 70%, saving $1M on responses. Secnap’s analysis shows $4 return per $1 spent here.
Enterprises demand proof. Global ops with $200K budget achieve 276% ROI per Forrester, from $1.1M PV benefits over three years.

Visuals like these highlight tailored approaches. Small groups review weekly; enterprises tie to SOC data.
Attribution challenges persist. Isolating sim impact from tools like email filters takes baseline comparisons.
Build Dashboards Execs Will Trust
Pull metrics into one view. Use tools like Tableau or Power BI. Show PPP trends, ROI calc, and incident correlations.
Key elements:
- Line charts for click/report rates over time.
- Bar graphs by department.
- ROI formula output with sliders for scenarios.
Limit to five visuals. Add quarterly risk scores: (PPP × Breach Cost × Employees).
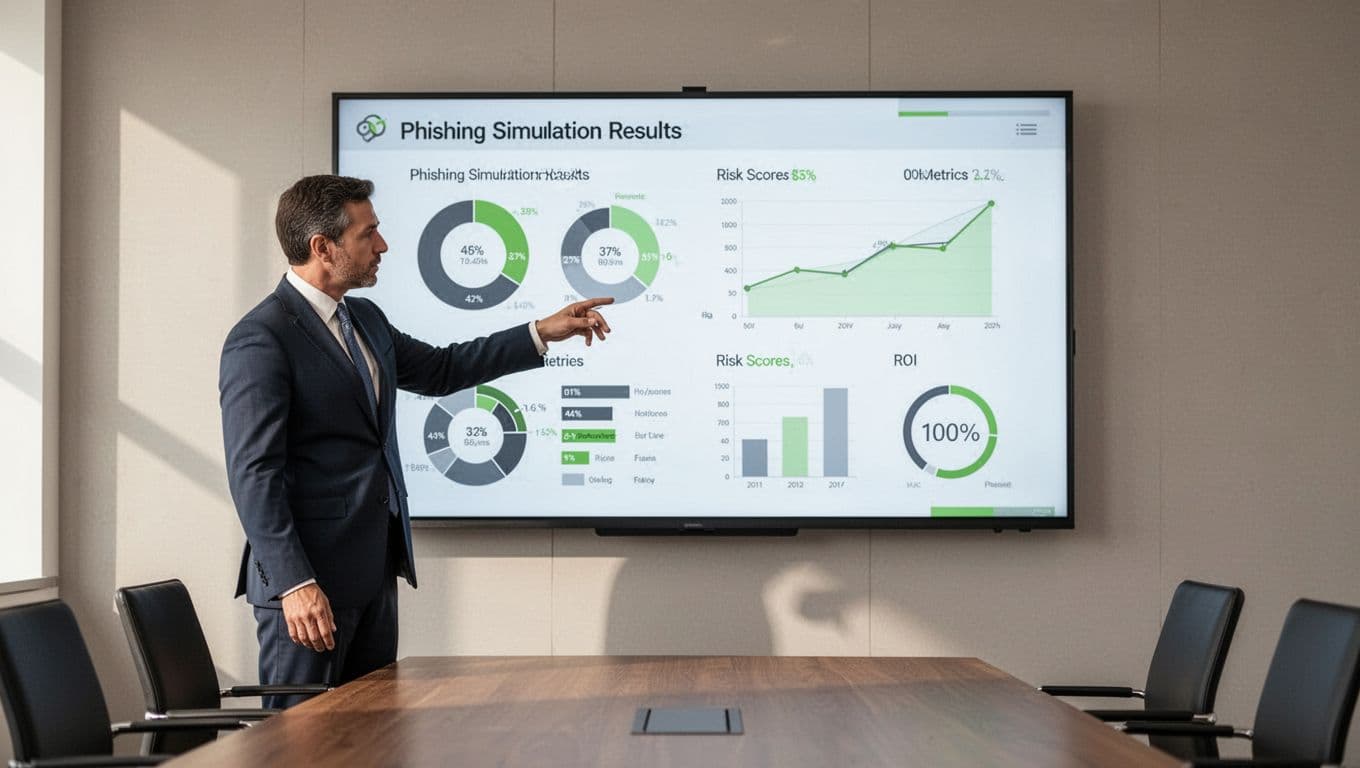
Dashboards like this win budgets. Update monthly; present with stories, not just charts.
Watch limitations. Simulations don’t catch all risks, like insider threats. Over-reliance ignores tech controls. Baseline pre-training data is essential.
Key Takeaways for Phishing Simulation ROI
Tie every metric to dollars saved or risks cut. Baseline PPP at 33%, aim for under 5% with steady sims. Use the ROI formula on real costs for credible numbers.
Expect 200-1,200% returns when linked to incidents. Build that dashboard now.
Struggling to implement? Book a Discovery Call with Bud Consulting for tailored advice on programs and talent.
Your simulations work. Prove it with data that sticks.