table of contents
You manage dozens of vendors. One high-risk issue slips through. It leads to a breach or compliance failure. Vendor risk dashboards fix that problem. They show remediation status at a glance. You spot delays fast. Teams act quicker. Progress becomes clear for everyone from analysts to executives.
These tools turn raw data into decisions. Risk scores update live. Accountability sticks because owners see their tasks. Audits get easier with visual proof. In short, dashboards cut through the noise.
Let’s break down what makes them work.
Why Vendor Risk Dashboards Boost Your Program
Vendor risks don’t fix themselves. Teams drown in spreadsheets and emails. Dashboards pull it all together. They highlight vendors needing urgent fixes. You prioritize based on impact, not guesswork.
Consider a cloud provider with weak access controls. Without a dashboard, you chase updates manually. With one, a red gauge flags it. Remediation time drops from weeks to days. Programs that use dashboards close critical findings 30% faster, based on industry benchmarks.
They also build trust. Executives see portfolio health in one view. No more vague reports. Procurement teams align on offboarding risky vendors. Security owns the metrics. Everyone wins.
Dashboards support audits too. Regulators want evidence of action. Screenshots and trends prove you monitor continuously. This setup scales as your vendor list grows.
Key Components of a Strong Vendor Risk Dashboard
Start with the basics. A good dashboard has risk scores front and center. Use gauges or heat maps for quick scans. Green means low risk. Red demands attention.
Add vendor profiles next. List top 10 by score. Include columns for owner, last assessment date, and open issues. Drill-down links take you to details.
Progress bars track remediation. Show percentage complete per finding. Tie them to due dates. Overdue items flash yellow or red.
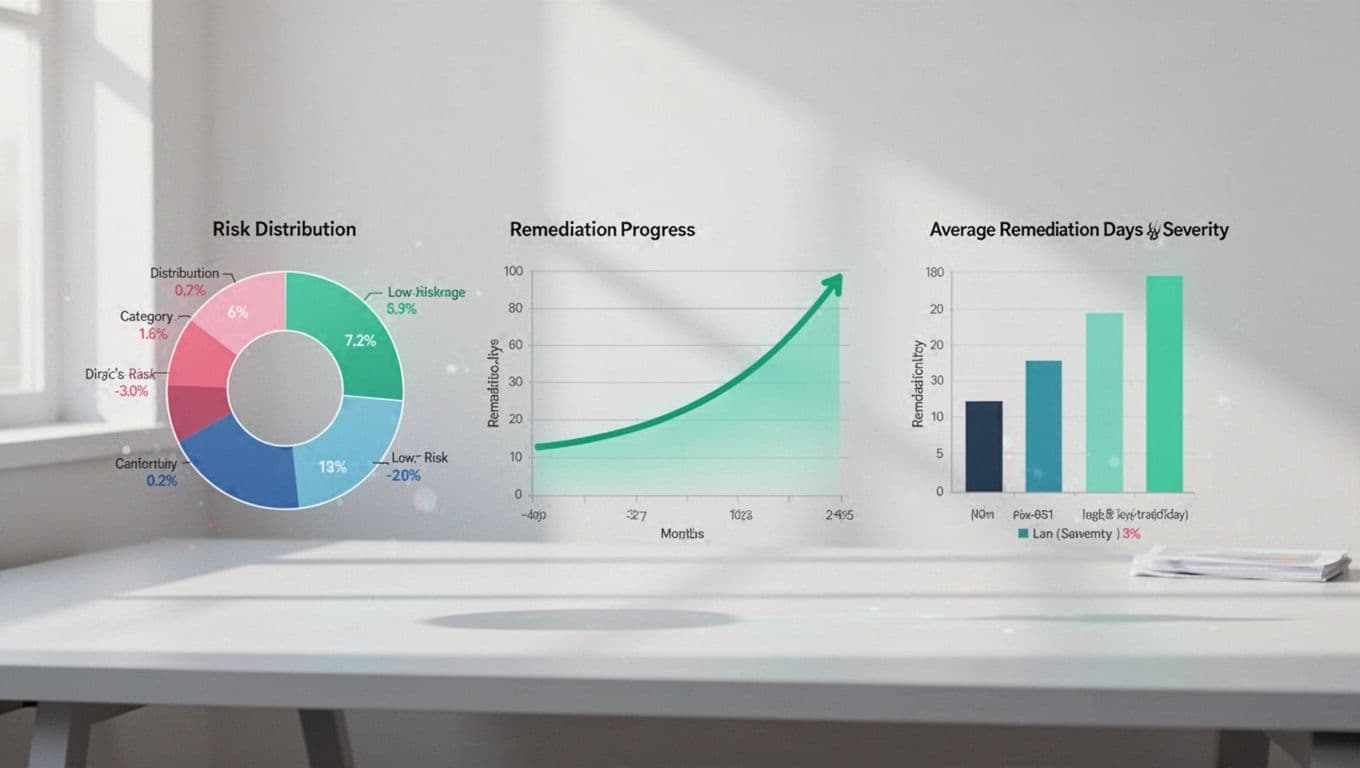
Summary widgets round it out. Pie charts split risks by category like security or financial. Trend lines show if scores improve over quarters.
For example, filter by tier. Critical vendors get their own tab. Operational ones share space. This keeps executives focused on what matters.
Integrate alerts. Email or Slack pings when a vendor score drops. No one misses a deadline.
Tools like those from UpGuard offer templates. They speed setup. Customize for your needs.
These parts make dashboards actionable. Teams respond faster. Risks shrink.
Essential Metrics to Monitor Remediation Progress
Pick metrics that drive action. Mean time to remediate tops the list. Track days from finding to fix. Aim for under 15 days on critical items.
Vendor score trends come next. Plot averages monthly. Upward lines mean success. Flat or down? Dig in.
Offboard rate matters too. Percentage of high-risk vendors cut each quarter. It shows tough decisions in play.
Coverage gaps highlight issues. What fraction of vendors have current assessments? Target 95% for critical tiers.
Remediation completion by severity rounds it out. Bars for high, medium, low. Compare against benchmarks.
Overdue tasks count stays key. Zero is ideal. Anything over triggers reviews.
Use these in DSALTA’s remediation guide for context. They balance risk reduction with speed.
For executives, add portfolio views. Total open findings. Risk exposure by spend. Operational teams need granular owner assignments.
Review weekly. Adjust targets based on data. This keeps your program sharp.
Best Practices for Dashboard Design and Reporting
Build for users first. Executives want summaries. Analysts need details. Role-based views handle both.
Keep it simple. Limit to 5-7 widgets per page. Clutter kills adoption.
Update data daily. Integrate with assessment tools. Manual entry fails.
Set thresholds. Auto-color code based on rules. Red over 30 days overdue.
Test with stakeholders. Run mock audits. Refine based on feedback, as noted in LinkedIn’s VRM design tips.
For reporting, export to PDF. Schedule monthly decks. Tie metrics to business impact like cost savings.
Train teams. Short sessions show how to act on signals. Accountability follows.
Common pitfall: too many metrics. Focus on 4-6 that tie to goals. Quality beats quantity.
These steps make dashboards stick. Progress accelerates.
Real-World Use Cases for Vendor Risk Dashboards
Financial firms use them for regulatory compliance. Dashboards track SOC 2 fixes. Auditors verify trends in seconds. One bank cut remediation time by 40%.
Healthcare teams prioritize by patient data exposure. Dashboards flag HIPAA gaps. Remediation owners get assigned tasks. Boards see quarterly wins.
Procurement integrates spend data. High-spend, high-risk vendors top lists. Decisions balance cost and security.
In manufacturing, supply chain dashboards monitor cyber risks. A parts vendor’s score drop halts shipments until fixed.

Retailers watch SaaS providers. Dashboards show uptime and patch status. Black Friday prep stays secure.
Atlas Systems’ tracker template fits these scenarios. Adapt it.
These examples prove dashboards deliver. Pick one that matches your pain.
Conclusion
Vendor risk dashboards transform remediation from reactive to routine. You track progress live. Teams own fixes. Executives stay informed.
Focus on key metrics and clean design. Results follow: fewer breaches, smoother audits, stronger posture.
Strong dashboards reduce risks across your vendor base. Start small. Scale with data.
Need help building one? Book a Discovery Call with Bud Consulting. They guide cybersecurity teams through it.