table of contents
Your Kubernetes clusters run microservices that face the internet. One misconfigured ingress controller exposes a dashboard. Attackers pivot inside via east-west traffic. These issues happen daily in 2026.
Teams struggle because assets change fast. Ephemeral pods spin up and down. Traditional scans miss the full picture. CTEM workflows fix this by running continuous discovery and prioritization.
You can cut exposure by 40% in weeks with the right steps. Let’s map out practical workflows that fit your setup.
Mapping Your Exposed Attack Surface
Start every CTEM workflow with discovery. Kubernetes clusters hide assets like exposed APIs and service meshes. North-south traffic hits ingress points first. Focus there to spot quick wins.
Use API queries on EKS or GKE. Pull pod lists, services, and ingresses. Check for open ports on 8080 or 3000. Dashboards like Grafana often sit unprotected.
East-west traffic adds risk. Pods talk without checks. Service meshes like Istio help, but gaps remain.
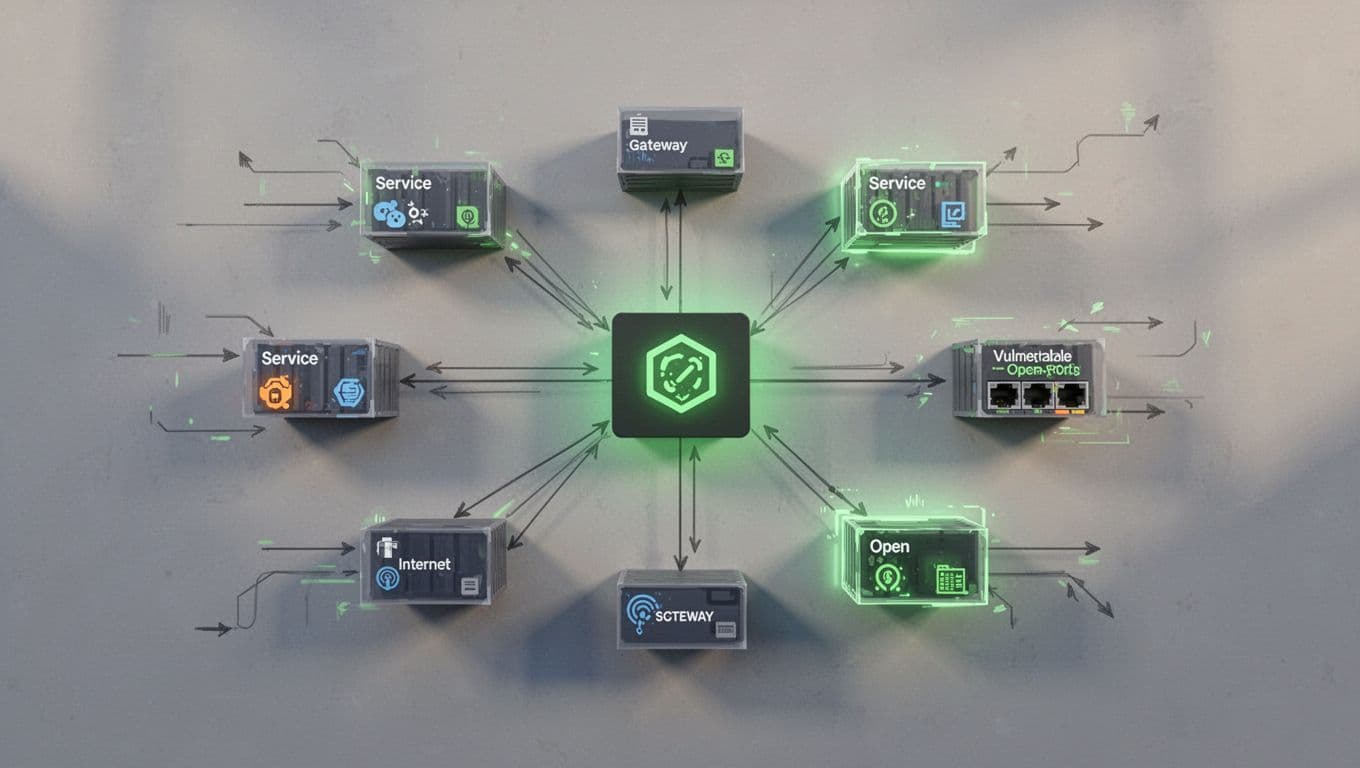
This diagram shows typical weak spots. Pods connect to an ingress. Arrows mark internet paths to ports and dashboards. Green highlights secure zones.
Run daily scans with cloud APIs. AWS lists load balancers open to 0.0.0.0/0. Azure flags public AKS endpoints. Combine with DNS lookups for rogue subdomains.
Ownership matters early. Tag resources by team. DevOps owns prod-cluster-a. Map identities too. Service accounts with cluster-admin roles scream risk.
In one setup, a team found 15 exposed Kibana instances. They sat behind ALBs with weak paths. Discovery took hours via kubectl and cloud CLI.
Core Principles of CTEM Workflows
CTEM workflows cycle through five steps: scope, discover, prioritize, validate, and mobilize. For microservices, scope means your clusters and meshes first.
Discovery pulls live data. Prioritize by business impact. Validate with tests. Mobilize fixes ownership and automates patches.
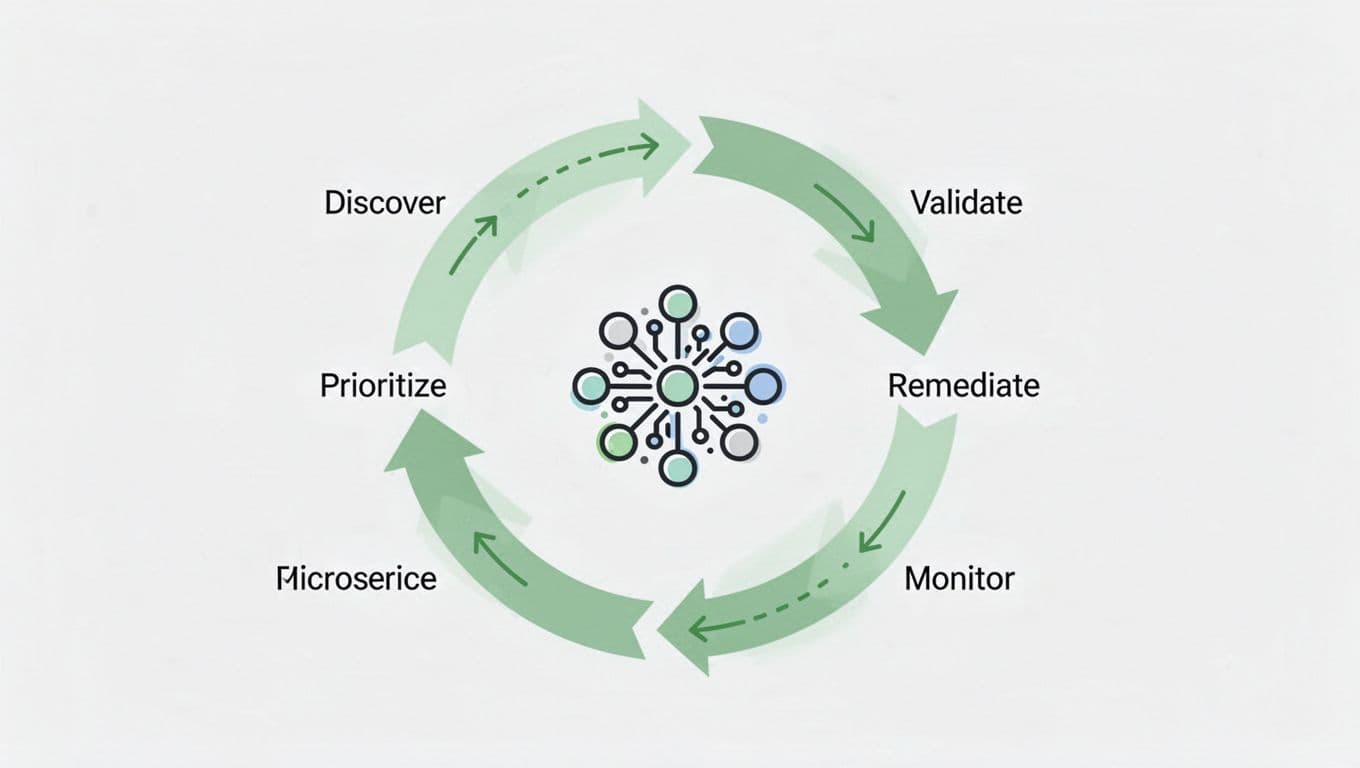
The cycle above centers on microservices icons. Arrows link steps in green. It runs non-stop for clusters.
Keep it vendor-neutral. Use open tools like kube-bench for posture checks. Integrate with your CNAPP for deeper scans.
A key principle: risk-based views. Severity scores ignore context. A CVSS 9.0 vuln in a test pod ranks low. One in prod payments ranks high.
Teams run this weekly at first. Automate to daily. Checkpoints include asset count and exposure delta.
For example, scope prod namespaces only. Discover via Prometheus queries. Prioritize by traffic volume.
Prioritizing Risks with CTEM Workflows
Not all exposures equal risk. Prioritize by attack paths. A dashboard leads to pod escape. That hits databases.
Build heat maps. Color assets red for high risk, green for medium, blue for low.
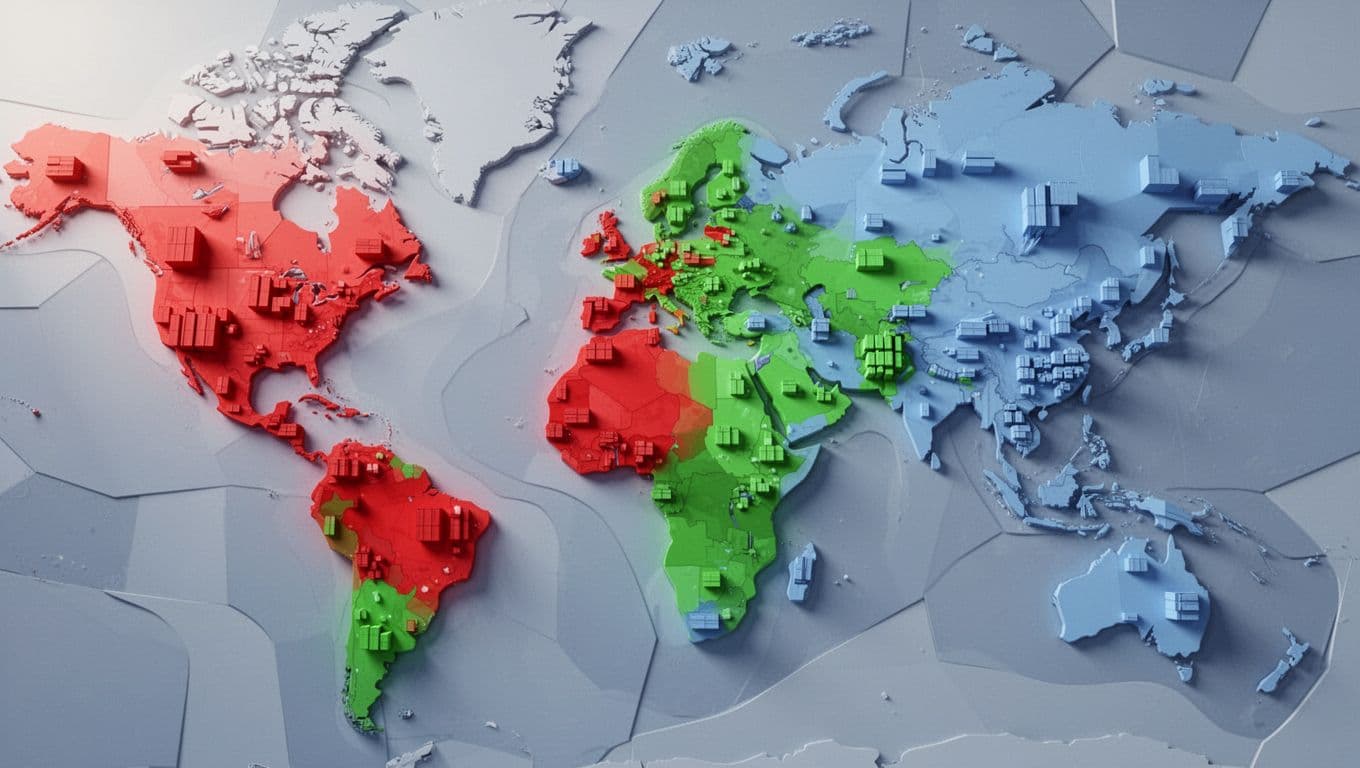
This heat map sorts Kubernetes assets. Red flags critical paths. Green shows managed risks.
Factor in identity misconfigs. Pods with hostPath mounts top lists. Service accounts without least privilege follow.
Use graph views. Link exposed ingress to internal services. Weight by exploitability.
In 2026, eBPF tools trace runtime paths. They spot east-west jumps without agents.
Set thresholds. Fix top 10% first. Track mean time to prioritize under 24 hours.
One team ranked 200 pods. Exposed Grafana pods hit red because they chained to etcd.
Securing East-West Traffic in Microservices
East-west traffic flows between pods. It dwarfs north-south volume. Unsecured meshes let attackers move.
Service meshes enforce mTLS. Sidecars proxy calls. Policies block unauthorized paths.
Sidecars block bad flows here. Green barriers secure talks. Red arrows show exposures.
Check Istio setups. Gateways handle ingress. Confirm mTLS modes. Istio’s security model details proxy redirects.
Workflow step: audit network policies. Deny all by default. Allow specific pod-to-pod.
Validate with chaos tests. Inject faults. See if traffic routes right.
For non-mesh clusters, use Calico or Cilium. They policy at kernel level.
A cluster audit found 80% east-west unsecured. Teams added NetworkPolicies. Risk dropped 50%.
Monitor anomalies. High pod-to-pod bytes signal scans.
Integrating CTEM with CNAPP CSPM ASPM
CTEM shines with integrations. CNAPP scans workloads. CSPM checks posture. ASPM handles APIs.
Link them for full views. CNAPP flags vuln pods. CSPM spots IAM gaps. ASPM tests endpoints.

Charts blend data here. Green ties CNAPP and CSPM into CTEM.
Pull CSPM alerts into CTEM prioritization. Weight by asset criticality. Palo Alto’s CNAPP integrations show credential flows.
ASPM adds API tests. Scan for broken auth. Integrate via webhooks.
Workflow: daily syncs. CTEM dashboard aggregates. Teams triage unified lists.
CrowdStrike unifies ASPM in CNAPP for code-to-cloud. Use similar feeds.
One org fed Prisma Cloud to CTEM. Duplicate alerts fell 70%. Paths lit up.
Validating Attack Paths in Exposed Clusters
Prioritization sets targets. Validation confirms exploitability. Run simulated attacks.
Use tools like kube-hunter. Probe for escapes. Test dashboard logins.
Chain paths. Exposed port to RBAC exploit to secrets. Graph databases model this.
XM Cyber’s Kubernetes exposure management maps paths to critical assets.
Assign owners during validation. Slack notifies cluster admins.
Checkpoint: 90% paths validated weekly. False positives drop with runtime data.
For ephemeral assets, snapshot on deploy. Validate before prod gate.
A team validated 20 paths. Five chained to prod DB. Fixed in days.
Automating Remediation and Ownership Mapping
Mobilize fixes fast. Automate where possible. OPA gates enforce policies.
Map ownership via labels. namespace:team-finance. Alerts route right.
GitOps for remediations. PRs fix NetworkPolicies. ArgoCD applies.
Daily monitors check drift. Revert bad deploys.
Integrate with ITSM. High-risk tickets auto-open.
KPIs track here. Mean time to remediate under 7 days.
One workflow: CTEM flags exposure. Owner gets playbook. Ansible runs patch.
Teams cut manual work 60%. Ownership clarity boosted accountability.
Cyberwatch’s CTEM guide outlines discovery to fixes.
Measuring Success with CTEM KPIs
Track progress with metrics. Exposure score: assets open to internet divided by total.
Aim for under 5%. Mean time to exposure: hours from deploy to detect.
Path reduction: attack paths down 30% quarterly.
Use dashboards. Grafana plots trends.
| KPI | Target | Measurement |
|---|---|---|
| Exposed Services | <10% | Ingress scans daily |
| East-West Risk Score | <2.0 | Policy coverage % |
| MTTR | <48 hours | Ticket velocity |
| False Positive Rate | <15% | Validation logs |
This table benchmarks basics. Set context first. Review monthly.
Path validation rate hits 95%. Teams celebrate drops.
Security Affairs on CTEM visibility ties to hybrid cuts.
Bud Consulting helps tune these. Book a Discovery Call with Bud Consulting for cluster audits.
Key Takeaways
CTEM workflows shrink risks in microservices clusters. Map exposures daily. Prioritize paths. Validate and automate fixes.
You cut attack surface 40% with consistent cycles. East-west secures next. Integrations amplify gains.
Teams win by measuring MTTR and path counts. Start small in one cluster. Scale out.
Your setups change fast. CTEM keeps pace. Act now for quieter SOC.