table of contents
Your third-party vendors handle sensitive data and critical operations. One weak link can trigger a supply chain attack, like the Asahi Beer outage earlier this year that halted factories worldwide. Regulators now demand proof you track these risks continuously.
In 2026, pressure from SEC rules, NYDFS, DORA, and NIS2 forces teams to measure vendor risks accurately. Poor metrics lead to fines or breaches. Good ones help prioritize fixes and show boards real progress.
This article covers practical third-party risk metrics you can track today. You’ll learn what they mean, how to calculate them, and what trends signal trouble.
Why Track Third-Party Risk Metrics in 2026
Supply chain attacks rose sharply this year. Marks & Spencer lost $400 million from a contractor breach. These events show vendors create blind spots.
Teams need metrics to spot issues early. Continuous monitoring beats annual audits. AI tools now pull real-time data on vendor scores and alerts.
Regulations push this shift. DORA requires EU firms to classify critical vendors and map dependencies. US banks face OCC scrutiny if vendors fail. Metrics prove compliance.
Focus on KRIs over lagging KPIs. A dropping vendor score predicts breaches better than past incidents. Track coverage first: percentage of high-risk vendors assessed. Low numbers mean gaps.
Boards want trends, not snapshots. A rising incident rate tied to vendors demands action. Calculate it as vendor-linked events divided by total vendors quarterly.
Tie metrics to outcomes. If remediation drags, high-risk vendors grow. This setup reduces exposure. For details on building these, check Mitratech’s guide to 25 TPRM KPIs and KRIs.
Operational Metrics Every TPRM Team Needs
Daily work demands simple, actionable numbers. Start with percentage of vendors assessed on time. Divide completed assessments by due ones, multiply by 100.
A score under 90% signals backlog. It hurts compliance with FINRA rules on vendor oversight. Teams fix this by automating questionnaires.
Next, control gap closure rate. Count fixed gaps versus open ones monthly. Targets: 80% for high-severity. Slow closure points to weak escalation.
Average remediation time tracks days from finding to fix. Aim for 30 days on critical issues. Over 60 days? Assign owners and set alerts.
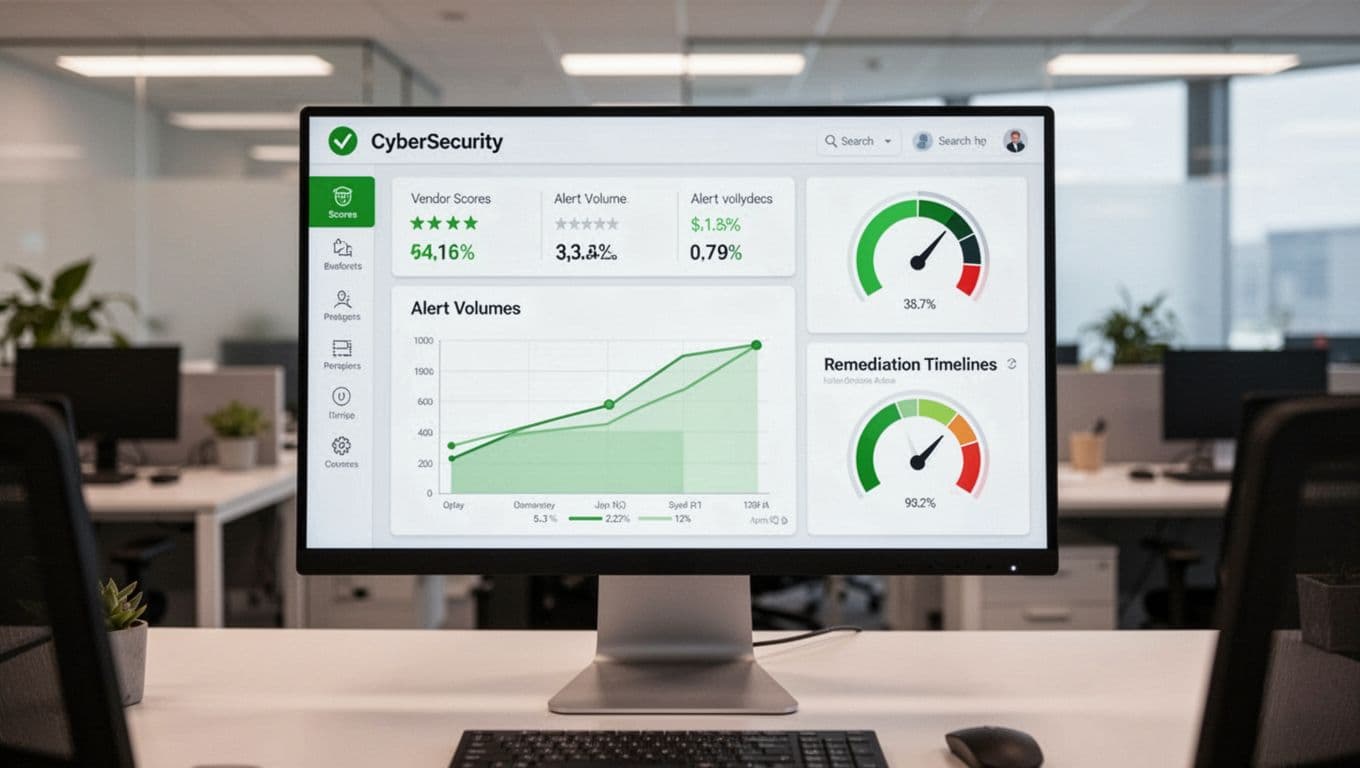
Continuous monitoring alert volume rounds it out. Log alerts from tools like SecurityScorecard. High volumes mean poor vendor hygiene. Review top offenders weekly.
These metrics drive triage. For example, if alerts spike for a cloud provider, pause new contracts. Operational teams use them in standups. They separate noise from threats.
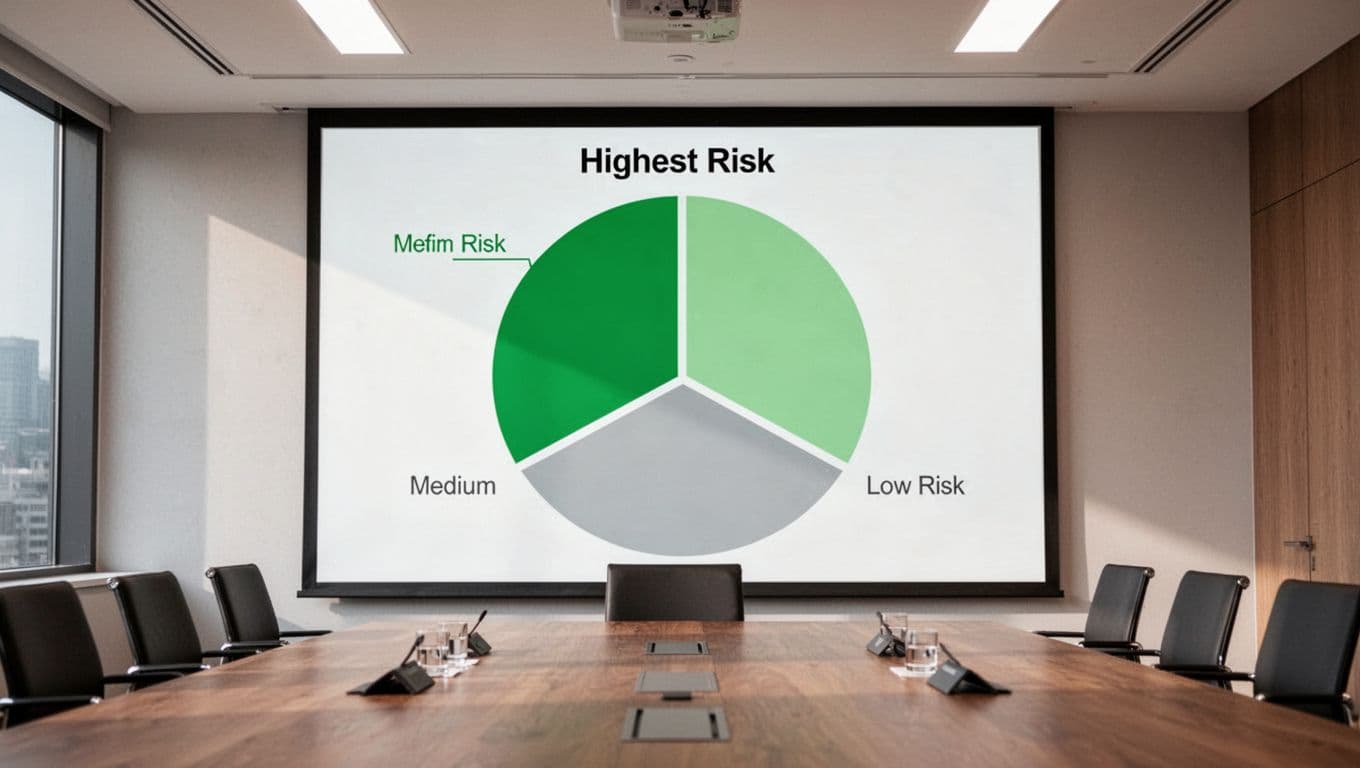
Vendor Criticality Distribution
Know your vendors’ risk levels. Criticality distribution shows percentages in high, medium, and low buckets.
Score vendors on data access, uptime impact, and sector. High-risk: those with customer data or core systems. Calculate as high-risk count over total vendors.
In 2026, aim for under 20% high-risk. More means over-reliance. A bank might find 30% high after inventory. That triggers deprovisioning.
Trends matter. If high-risk grows, reassess scoring. Low distribution? You underclassify, missing NIS2 supply chain rules.
Use this for prioritization. Assess high-risk quarterly. It aligns procurement with security. See Prevalent’s process for effective TPRM metrics for scoring tips.
Timeliness in Assessments and SLA Adherence
Delays kill programs. Track percentage of vendors assessed on time. Formula: on-schedule assessments divided by total scheduled.
Under 85%? Automate reminders. Regulators like NYDFS check this in exams.
SLA adherence rate follows. Measure vendors meeting uptime or response contracts. Divide compliant vendors by total. Target 95%.
Breaches rose in 2026 supply chain hits. Poor SLAs predict outages. Flag repeat offenders for contract reviews.
Average days to assessment completion helps. Median under 45 days keeps pace. Long times scatter data across systems.
These metrics spot operational drags. For instance, if procurement bottlenecks assessments, integrate tools. They tie to board asks on efficiency.
Number of High-Risk Vendors and Incident Counts
Count high-risk vendors outright. List those scoring over 70 on your scale. Track monthly changes.
A climb means new threats or poor onboarding. Cap at 15% of portfolio. Excess demands mitigation plans.
Incident counts tied to vendors measure impact. Log events where vendors caused downtime or leaks. Divide by vendor count for rate.

Declining trends show success. Rising? Drill into causes like unpatched flaws. 2026 attacks, such as National Defense Corporation’s file theft, highlight this need.
Combine with remediation time. Long fixes amplify incidents. Use for quarterly reviews. Low counts justify budget.
Fourth-Party Exposure Visibility
Vendors use subs. Fourth-parties create hidden risks. Measure visibility: percentage with mapped subs.
Survey vendors for sub lists. Score completeness. Under 70%? Require disclosures in contracts.

Track undisclosed changes. Count notifications received. DORA mandates this for critical ICT providers.
Tools like Bitsight offer continuous scans. High exposure correlates with breaches. Aim for 90% mapping on tier-1 vendors.
This metric prevents cascade failures. If a sub breaches, you act fast. Integrate with Atlas Systems’ continuous monitoring guide.
Executive KPIs That Drive Board Reporting
Leaders need summaries. Vendor score trajectory tracks average changes over 90 days. Dropping scores trigger reviews.
Portfolio risk score averages all vendors. Stable or falling proves control. Boards love trends.
| KPI | Calculation | Good Trend | Bad Signal |
|---|---|---|---|
| Score Trajectory | Avg change in 90 days | Stable or -5% | -15% drop |
| High-Risk % | High count / total | Under 20% | Rising |
| Incident Rate | Events / vendors | Declining | Increasing |
| Closure Rate | Fixed / open gaps | 85%+ | Under 80% |
This table shows at-a-glance value. Use for DORA reports.

KRIs like lapsed certs predict issues. Tie to decisions: cut vendors with declines. For more, read Security Boulevard’s 2026 best practices.
Avoid Vanity Metrics and Focus on Decisions
Coverage sounds good but lies if inventory misses vendors. Track against full lists.
Vendor count impresses but ignores risk. Weight by criticality.
Link metrics to actions. High alerts? Prioritize scans. Slow closures? Escalate.
In 2026, AI flags trends automatically. Use for prioritization over volume.
This approach cuts incidents 30% in mature programs. Boards see reduced exposure.
If metrics overwhelm, book a discovery call with Bud Consulting for tailored advice.
Key Takeaways for Third-Party Risk Management
Strong third-party risk metrics spot threats early and prove value. Focus on timeliness, closures, and trends over raw counts.
High-risk distributions and incident declines guide cuts. Continuous fourth-party mapping meets regs like NIS2.
Boards trust falling trajectories. Avoid vanity traps by tying data to fixes.
Build dashboards now. Your next breach depends on it.